Will rate hikes propel gold to all-time highs?
Gold prices have soared in recent weeks, with the conflict between Russia and the Ukraine at one point pushing prices back above USD 2,000 and AUD 2,800 per troy ounce (oz).
The rally comes after a roughly 15 month period in which gold prices were in a corrective pattern, having fallen by about 15% between August 2020 and January of this year.
Several factors drove this correction, including:
- A rising US dollar, which was up 6% in 2021.
- Stronger than expected economic growth.
- An incredibly strong rally in equities, with the S&P 500 up more than 25% in 2021.
- Cryptocurrency price strength for most of 2021, with Bitcoin at one point pushing up toward USD 70,000 per coin.
On top of these non-precious metal specific factors, gold itself was also overdue for a correction, having rallied by approximately 70% from below USD 1,200 to more than USD 2,050 oz between late 2018 and late 2020.
And while for now all eyes are on the Ukraine, there is another catalyst for higher gold prices that may soon come to the fore. Higher interest rates
Won’t higher rates sink gold?
In theory, gold prices should be on the back foot in 2022, with higher interest rates and the conclusion of the various quantitative easing programs undertaken by global central banks to support economies through the pandemic representing potential headwinds for the precious metal.
The logic is simple enough - gold doesn’t pay an income. Therefore, if the interest rates one can earn in a bank account or term deposit are on the rise, then the opportunity cost of owning gold is going up, which should be bearish for the gold price.
In reality, history demonstrates that gold prices have typically tended to rise alongside increases in interest rates. This can be seen in the table, which looks at rate hiking cycles and movements in the US dollar gold price over the last 50 years.
Rate hike cycles and US dollar gold price returns – 1972 to 2021
Date (start hike cycle)
Date (end hike cycle)
Effective Federal funds rate (start)
Effective Federal funds rate (end)
USD gold price (start)
USD gold price (end)
Gold price return (%)
31/1/72
31/7/74
3.5
12.9
47.60
157.30
230.5%
31/1/77
31/1/81
4.6
19.1
131.30
506.50
285.8%
31/10/86
31/5/89
5.9
9.8
404.66
363.17
-10.3%
31/12/93
30/6/95
3.0
6.0
390.50
384.15
-1.6%
31/5/04
30/9/06
1.0
5.3
393.80
597.80
51.8%
31/12/15
31/7/19
0.2
2.4
1060.91
1413.55
33.2%
Source: St Louis Federal Reserve, The Perth Mint, World Gold Council
Apart from the mid-1980s, when gold fell by 10%, and a very small decline between 1993 and 1995, gold prices have tended to rise, often quite considerably, in periods the US Federal Reserve has increased interest rates.
Across the six rate hiking cycles highlighted in the table above, the gold price has increased by an average of almost 100%.
This data highlights quite clearly that higher interest rates themselves are not necessarily bearish for gold. Movements in the stock market and the value of the US dollar, as well as broader economic conditions also influence demand for, and therefore the price of, the precious metal.
Keep an eye on inflation
One factor to keep a close eye on in 2022 is inflation.
While gold doesn’t always go up when inflation is running hot, it does have one of the best track records of any asset class as a hedge against rising consumer prices.
As an example, analysis conducted by The Perth Mint shows that the gold price in Australian dollars has on average risen by just over 20% in nominal terms in years local inflation was 3% or higher.
This can be seen in the table below.
Australian inflation and average gold price returns (%) 1971 to 2021
Inflation environment
Number of years inflation in this bracket
Average nominal gold return (%)
Less than 3% p.a
27
3.6%
More than 3% p.a
23
20.4%
Source: The Perth Mint, Australian Bureau of Statistics, World Gold Council
What makes the inflation outlook so interesting for gold going forward is that, at present, the market is expecting inflation rates to rapidly decelerate, and to stay low in the decade ahead.
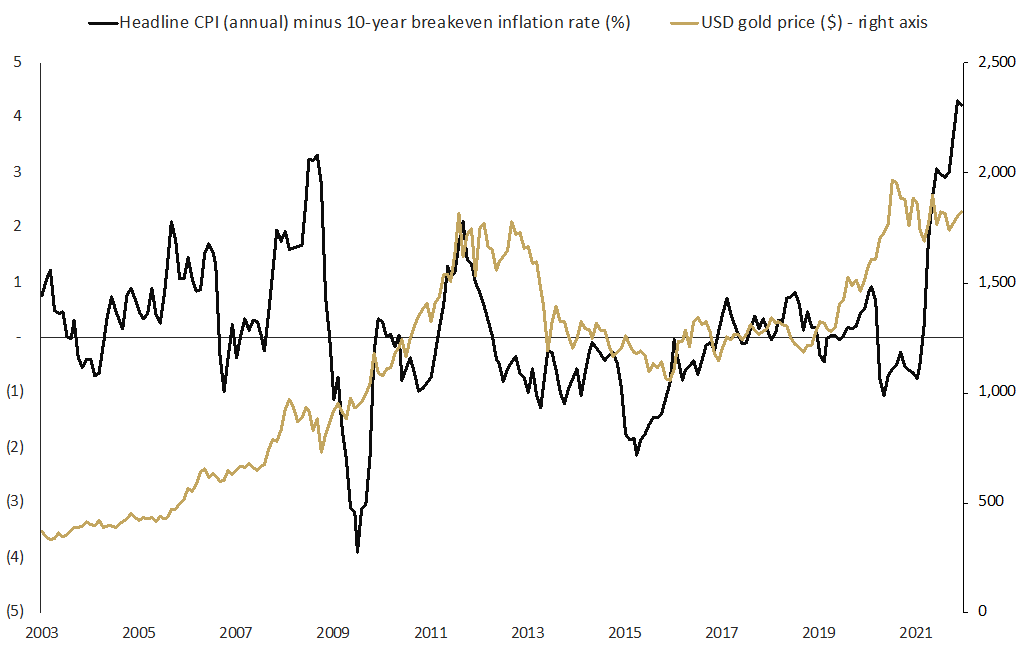
This can best be visualised when considering the fact that while headline CPI rates hit 7% in the United States by the end of December 2021, the 10-year breakeven inflation rate, which measures what the market expects inflation to average in the next 10 years, was just 2.56%.
That is the largest gap in 20 years between the current CPI rates and 10-year breakeven inflation rates. This can be seen in the chart below, which also highlights the US dollar gold price during this time.
Gap between current CPI rates and 10-year breakeven inflation rates 2003 - 2021
 Source: The Perth Mint, St Louis Fed, Bureau of Labor Statistics
The only other time we’ve seen anything like this kind of gap was back in 2008, when there was more than a 3% difference between the headline CPI rate and the 10-year breakeven inflation rate.
Back then, like now, gold went through a corrective period, at one point falling by approximately 20%. That corrective cycle was short-lived and ended with an explosive move to the upside, with gold rallying by more than 150% in the three years that followed.
Given this history, and the fact there is plenty of room for CPI growth to fall yet still overshoot market expectations, there are multiple reasons to think current inflation dynamics will ultimately lead to higher gold prices in the years ahead, irrespective of what happens with interest rates.
DISCLAIMER
Past performance does not guarantee future results. The information in this article and the links provided are for general information only and should not be taken as constituting professional advice from The Perth Mint. The Perth Mint is not a financial adviser. You should consider seeking independent financial advice to check how the information in this article relates to your unique circumstances. All data, including prices, quotes, valuations and statistics included have been obtained from sources The Perth Mint deems to be reliable, but we do not guarantee their accuracy or completeness. The Perth Mint is not liable for any loss caused, whether due to negligence or otherwise, arising from the use of, or reliance on, the information provided directly or indirectly, by use of this article.