Diversify or let your winners run? How to encourage your portfolio to bloom
There is no shortage of investment information and tips for investors looking to grow their portfolio. The challenge is how to turn them into actionable insights that work for the individual, something that is made even harder by the fact that while many of these tips make sense as standalone concepts, they can conflict with each other.
Consider the fact that many investment advisers talk of the need to have a diversified portfolio, which is another way of saying don’t put all your eggs in one basket. Those who embrace diversification fully expect that at any point in time they’ll have some exposure to asset classes that are rising in value, and some that are falling.
There is nothing wrong with this approach, and indeed investment legend, Nobel Prize laureate and founder of Modern Portfolio Theory, Harry Markowitz, once described diversification as “the only free lunch in finance”.
Meanwhile, other famous investors talk of the need to give outperformers room to grow while cutting losses in underperforming assets. Indeed, none other than Warren Buffett was fond of saying selling your winners and holding your losers is like cutting the flowers and watering the weeds, though it’s not his quote originally.
In practice, disciples of this school of thought believe in concentrated portfolios as the best way to build wealth.
These two arguments – diversification versus letting your winners run, are to some degree in conflict with each other.
As to which one is ‘right’, Buffett’s view makes a lot of sense in the context of owning a particular stock, but from an asset allocation perspective, which is the primary driver of diversified portfolio returns, one could argue it doesn’t.
After all, history is very clear that markets move in cycles, and asset classes that see years of outperformance (the flowers) eventually run out of steam and turn into losers (the weeds).
What is an investor to do?
Below we look at three hypothetical portfolios comprised of just two asset classes, equities (using the S&P 500 to proxy returns) and gold, highlighting the returns and risks over a 50-year time period from 1971 to 2020.
Note that we’ve used a starting balance of $10,000 evenly split between the two asset classes, with the three portfolio simulations as follows:
- Never rebalancing the portfolio.
- Rebalancing back to 50% allocations each year.
- Rebalancing back to 50% allocations each decade.
The table below highlights the results, from both a return and risk perspective for the three portfolios.
Equity and gold portfolio statistics – 1971 to 2020
Portfolio statistics
Never rebalance
Annual rebalance
Rebalance every decade
Starting value
10,000.00
10,000.00
10,000.00
End value
1,095,404.72
1,629,106.85
4,276,068.24
Annual return
9.8%
10.7%
12.9%
Volatility
20.46%
14.4%
18.8%
Best year (%)
106%
73%
106%
Best year
1979
1979
1979
Worst year (%)
-29%
-19%
-19%
Worst year ...
1981
1981
1975
Maximum equity allocation
85%
66%
88%
Maximum gold allocation
89%
70%
89%
Source: The Perth Mint, LBMA, NYU Stern
The table makes it clear that the pure buy and hold approach is the lowest returning strategy of the lot, generating returns of just under 10% per annum over the past five decades.
The portfolio that embraces annual rebalancing is the second-best performer, generating returns of just over 10.5% per annum, and also exhibits much lower volatility than the other two portfolios.
This is because the annual rebalancing back to a 50% weight to each asset (in practice selling a bit of last year’s flowers and buying a bit of last year’s weeds) means the maximum allocation it ever has to either asset class is much lower than the other two portfolios.
This can be seen in the chart below, which looks at the allocation to gold for each portfolio over time. Note how the portfolio that rebalances once a decade, and the portfolio that never rebalances, had maximum gold allocations of almost 90% by the end of the 1970s, and just over 10% towards the end of the 1990s. The portfolio that rebalances every year never gets to those extremes.
Gold weights as a percentage of total portfolio assets – 1971 to 2020
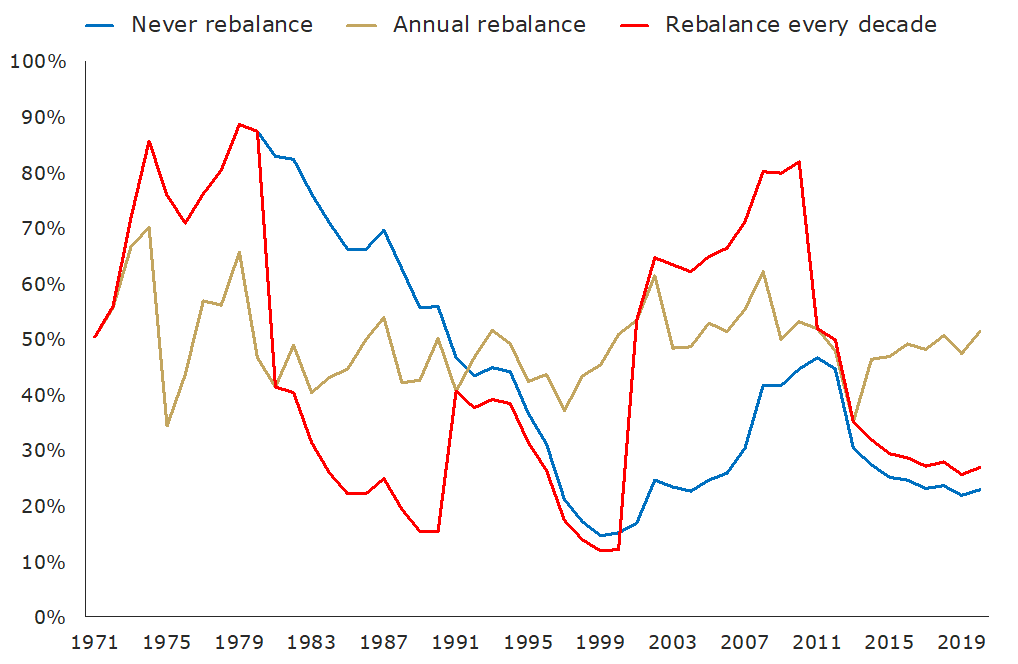
Source: The Perth Mint, LBMA, NYU Stern
So while the portfolio that never rebalances, and the portfolio that rebalances every year, both had their worst calendar year in 1981 (primarily driven by a 32% fall in gold), the latter portfolio fell by only 18.6%, versus an almost 30% dip for the portfolio that never rebalances.
The portfolio that rebalances every decade is by far the best performer of the three, with annual returns of almost 13% per annum. In many ways this makes sense, as it allows market cycles time to play out, giving the flowers 10 years to grow, and the weeds 10 years to shrivel, before rebalancing the portfolio.
The difference in terms of total dollar value gained from this portfolio relative to the others is staggering when compounded over five decades.
Interestingly, the portfolio that rebalances every decade is not only able to achieve returns that are 3% per annum higher than the portfolio that never rebalances, but also displays lower overall portfolio volatility, and had a worst year that is essentially in line with the portfolio that rebalances annually.
These findings suggest there is value in adopting a hybrid approach between letting your winners run and aiming for a diversified portfolio.
After all, if you never rebalance, you’ll end up with a portfolio too heavily weighted to last year’s, or last decade’s winning asset. You will then suffer when the tide turns against that asset.
Conversely, if you always rebalance, you aren’t giving your flowers any real time to grow, with investment cycles needing years to fully play out. That can clearly cost you substantial returns over the long run.
Limitations of the study
Backwards looking exercises in portfolio modelling are by definition limited. There are four primary factors which the above model doesn’t account for, all of which would impact the total return from each of three portfolio simulations. They are as follows:
- Inflation: In the past 50 years, inflation has averaged just below 4% per annum. This would obviously negatively impact the real return generated by all portfolios.
- Taxes: Tax on the income stream generated from dividends, plus any capital gains from sales of gold and equities, will also diminish total returns.
- Transaction costs: The more you trade, the more you pay in brokerage fees and/or buy sell spreads.
- Management or storage fees: There is typically some kind of fee paid for holding any kind of investment, which will also impact total returns.
Last but not least, these portfolios exist only on a spreadsheet. They don’t take the risk profile, or psychology of an investor into account.
For example, in the portfolio that rebalances every decade, the allocation to gold by the end of the year 2000 was just 12%. That’s because the 1990s was one of the best decades on record for equities, with average annual returns of more than 20%, while gold languished. The headlines at the time were proclaiming the precious metal was dead and that the stock market was certain to head ever higher.
Hindsight proved it was a wise choice, but how many people in the year 2000 would have felt comfortable selling almost half of their equity portfolio and using the proceeds to buy gold.
What to do now?
The example above of an investor selling down the equity component of their portfolio and using the proceeds to buy gold is arguably just as relevant today as it was 20 years ago.
This is because the last 12 months, and indeed the last 10 years, have seeing equities strongly outperform gold, evidenced in the below chart, which highlights the rolling 10-year performance differential between the S&P 500 and the precious metal.
Rolling 10 year performance - S&P 500 (price index) minus US dollar gold
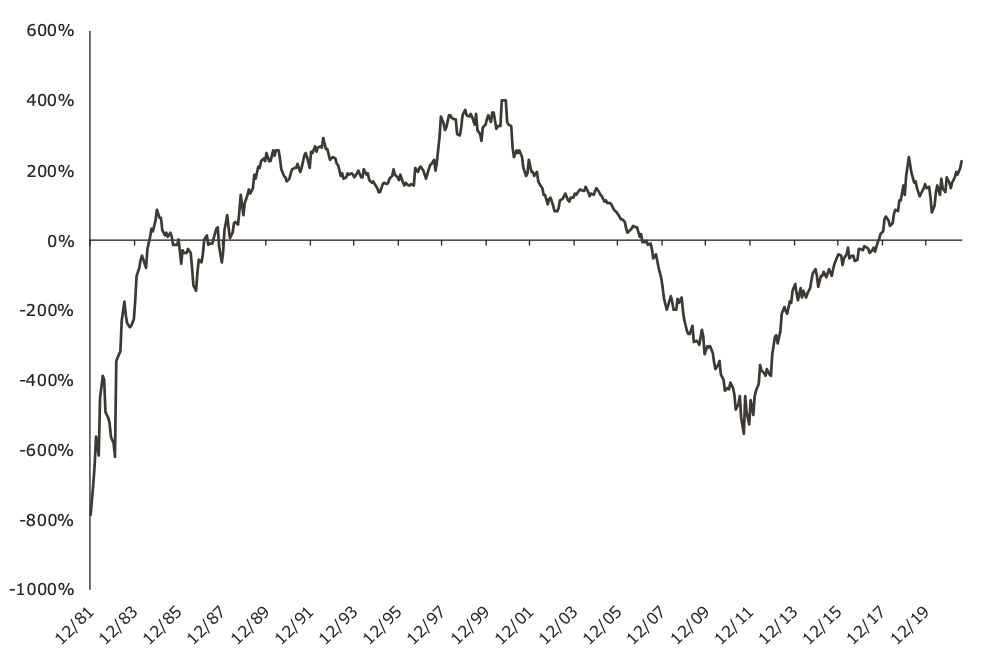
Source: The Perth Mint, World Gold Council
From an asset allocation perspective, this means the gold portion of the portfolio that aims to rebalance every decade was just 27% by the end of last year, which can be seen in the table below.
Gold allocations
Never rebalance
Annual rebalance
Rebalance every decade
1980
87%
47%
87%
1990
56%
50%
15%
2000
15%
51%
12%
2010
45%
53%
82%
2020
23%
51%
27%
That’s not quite as low as it was at the end of 1990 or 2000, but it is clearly a lot closer to those levels compared to the more than 80% allocations to gold this portfolio held by 1980 and 2010, which were at or near the top of long bull markets in the precious metal.
On a relative basis at least, this suggests that gold is cheap today.
DISCLAIMER
Past performance does not guarantee future results. The information in this article and the links provided are for general information only and should not be taken as constituting professional advice from The Perth Mint. The Perth Mint is not a financial adviser. You should consider seeking independent financial advice to check how the information in this article relates to your unique circumstances. All data, including prices, quotes, valuations and statistics included have been obtained from sources The Perth Mint deems to be reliable, but we do not guarantee their accuracy or completeness. The Perth Mint is not liable for any loss caused, whether due to negligence or otherwise, arising from the use of, or reliance on, the information provided directly or indirectly, by use of this article.