


Bargain hunters stock up as gold prices fall

Gold prices continued to correct in March 2021, suffering a 3% decline and ending the month below USD 1,700 per troy ounce. Multiple factors have driven the correction, with sentiment reading showing the market is now deeply unloved. While volatility is expected to persist, the correction in prices since August last year may be close to ending, with astute investors adding to their holdings during the recent weakness.
Summary of market moves:
- The Australian dollar gold price fell by just 1.50%, finishing the month trading above 2,200 per troy ounce. Over the past year, Australian dollar gold prices are now down by just over 15%, with the pullback largely driven by the increase in the value of the local currency, which rallied 23% in the 12 months to March 2021.
- Silver also fell sharply during March, ending the month down by more than 10%. YTD it is still outperforming gold, with the gold to silver ratio ending Q1 2021 at 70
- Global stock markets continued to rally in March, with the S&P 500 in the US increasing by 4%. In early April, the index topped 4,000 points for the first time.
- Yields in the US continued to climb, with 10-year bonds ending March with a yield of +1.74%, up from +1.44% at the end of February. This contributed to the continued increase in real yields, though they remain negative on all Treasury bonds with maturities of 20 years or less.
- US dollar strength was also a contributor to precious metal price weakness, with the US Dollar Index (DXY) rising by 3% during March.
Full report - March 2021
Gold and silver prices continued to weaken in March, with the precious metals falling by 11% (gold) and 9% (silver) in the first three months of 2021. The decline in the gold price represents the third largest quarterly decline and the weakest start to a year in two decades.
There were multiple factors contributing to the sell-off, which has now seen the US dollar gold price pull back by almost 20% since it hit all-time highs in August 2020. These factors include a rally in the US dollar, which rose by close to 3% in March, as well as an increase in real bond yields.
Soaring prices for cryptocurrencies also chipped away at gold demand, with Bitcoin trading near USD 60,000, while a range of crypto-friendly developments contributed to a weakening in sentiment toward precious metals.
Finally, continued strength in equity markets, with the S&P 500 topping 4,000 points in early April, combined with rising optimism regarding economic growth amid continued fiscal and monetary support, have also limited safe haven demand for gold, even as inflation expectations continue to rise.
In this detailed market report, we look at a range of factors from bond yields, to inflation rates, to gold’s interplay with commodities, as well as demand in the ETF, gold futures and bar and coin market, to gauge where precious metals sit today and contextualise their recent performance.
The report finishes by looking at sentiment in the gold market and why, perhaps more than any other factor, it encourages us that the correction in gold may be nearing its end, with the precious metal already reclaiming the USD 1,700 per troy ounce level in early April.
Yields and inflation
One factor that has contributed to the sell-off in gold has been the increase in bond yields.
This can be seen in the table below, which plots the nominal bond yield on a range of US Treasury bonds on 6 August 2020 and 31 March 2021, as well as gold prices on those days.
Date
2 year
5 year
10 year
20 year
30 year
Gold price
06/08/2020
0.11%
0.21%
0.55%
0.98%
1.2%
2067.2
31/03/2021
0.16%
0.92%
1.74%
2.31%
2.41%
1691.1
Source: US Treasury
Rising yields, particularly at the longer end of the market, have been a factor pulling gold down, as these higher yields represent an increased opportunity cost of investing in the precious metal.
Given the market expects that economic growth rates will continue to improve and that record levels of fiscal stimulus will see continued upward pressure on bond yields, it is understandable why many think the outlook for gold is still troubled at best.
Logical as this may sound, market history demonstrates very clearly that gold often thrives in environments where nominal bond yields are rising.
Consider that in the 1970s, the US 10-year bond yield rose from close to 6% to more than 12% (it peaked closer to 15% in 1981). In that 10 years bond yields doubled and the gold price rallied from under USD 50 to more than USD 580 per troy ounce.
In the early 2000s we saw a similar phenomenon at play. In May 2003 the US 10-year bond yielded 3.37%. By June 2006, the yield on the US 10-year hit 5.15%, an increase of 50% relative to where it sat in May 2003. Over the same period, the gold price rose by almost 85%, increasing from USD 341 to USD 629 per troy ounce.
Clearly, nominal yields are only one factor at play, with changes in inflation dynamics helping to provide a better understanding of gold price movements.
Over the past six months, while inflation and inflation expectations have continued to rise (the US 10-year breakeven inflation rate has gone from +1.63% to +2.37%), real yields have increased, with the US 10-year treasury bond seeing its real yield climb from -0.94% to -0.63%.
It’s also worth stating that while inflation (CPI) rates are rising, they remain comfortably toward the lower end of the historical range, with official US CPI increasing by just 1.7% in the 12 months to end February 2021.
Inflation rates are also coming off a very low base, driven by the collapse in economic activity and in commodity prices that took place last year.
Given this backdrop, both the market and policymakers are likely to ‘look through’ rising inflation rates for most of 2021 at least, with many seeing a returning inflation impulse as a good thing and a sign of a rebounding economy.
This in part explains why gold has pulled back the way it has in the last six months.
Commodity prices soaring- why not gold?
Another factor confounding some investors is the fact that broader commodity indexes have soared in the past six months, with energy, agriculture and industrial metal indices up anywhere from 20-35% since August, while gold has fallen.
On the surface this might seem strange, but the World Gold Council (WGC) published a great article on this phenomenon in late March. Titled Gold, commodities and reflation, it noted that gold’s weak performance in the last few months is consistent with past reflationary episodes.
The article also noted that the bounce in commodities has come off a multi-decade low as a base. Gold, by contrast, started 2020 trading at more than USD 1,500 per troy ounce, having risen by almost 20% in the preceding year, and of course increased in value during Q1 2020. By contrast, commodity prices, which were broadly flat in 2019, cratered during the first quarter of last year, falling by almost 25%.
Given such vastly different starting points, it should be no surprise that commodities have outperformed gold as strongly as they have over the last six to 12 months.
Looking ahead, there is reason for precious metal bulls to be enthusiastic, as the WGC report noted that: “gold has on average caught up to most major commodity groups by the second and third years from the start of a reflationary period since 1991.”
Gold futures market and ETF positioning
Since the correction in precious metal prices that began in August last year, speculators who use the futures market to express a view on gold, and ETF holders, have drastically trimmed their positions.
In the gold ETF space, more than 310 tonnes of gold have been divested since September 2020, when total holdings hit an all-time calendar quarter high of just over 3,880 tonnes. The market value of these gold ETF holdings has declined by closer to 20% over this time period, having fallen by more than USD 45 billion.
To put it in context, the sheer volume of outflows from gold ETFs seen over the last six months has only been outpaced once. That was back in 2013, when the gold price fell by more than 25%, with total gold ETF holdings falling by more than 30% that year.
In the futures market, managed money long positions declined to just 113,000 contracts by the end of March 2021. That is a decline of almost 60% relative to where positioning was back in late February 2020. It’s also almost 30% lower than average long positioning seen in the market since 2009.
Meanwhile, the managed money gross short position in the gold market was almost 70,000 contracts at the end of March, up from closer to 10,000 contracts a year ago.
While part of the absence of short positioning in the market a year ago was a result of the logistical challenges of moving gold during peak COVID uncertainty (spreads between spot gold and the nearest dated futures contracts blew out as a result during this period), there is no doubt the market is far more cautiously positioned today.
This can be seen in the chart below, which highlights gross long and gross short positions, as well as the US dollar gold price from 2009 through to end March 2021.
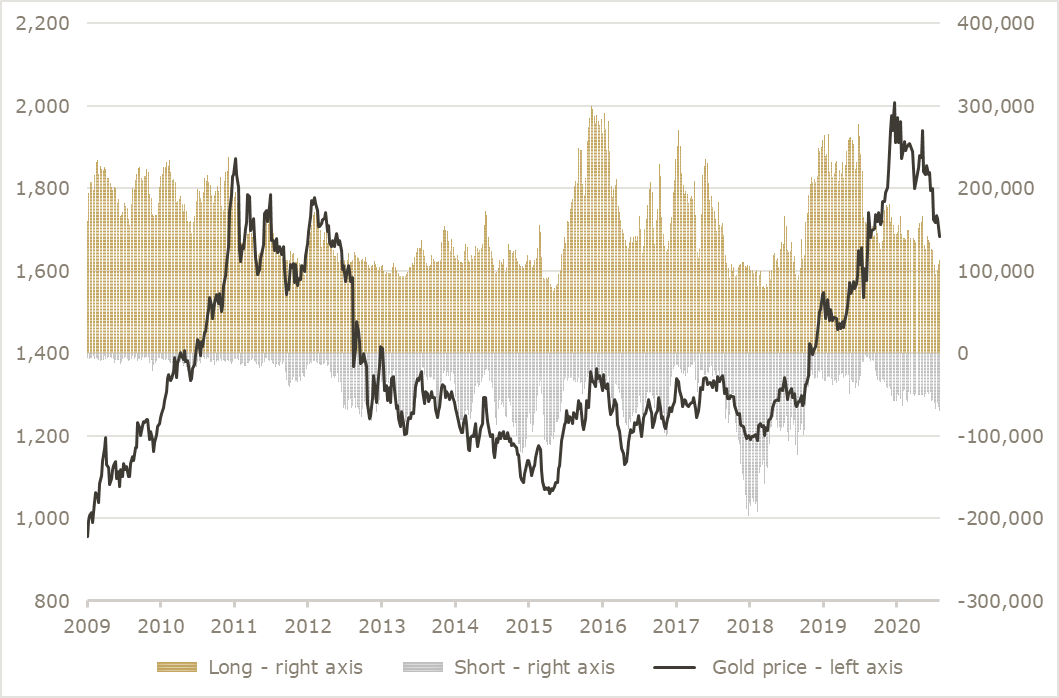
Source: CFTC, Y-charts, The Perth Mint
This chart is another indicator that the precious metal market has either already bottomed or is in the process of doing so. In the past decade, managed money readings have only twice been as, or more cautious than, they are today.
The first time was in 2015, when gold was ending a four-year bear market cycle, and again in late 2018, when the precious metal was trading below USD 1,200 per troy ounce.
Both occasions proved to be a good time to add precious metals to an investment portfolio.
Physical demand rising
While the gold ETF market continues to see outflows and the futures market continues to see speculators unwind their positions, there are more encouraging signs in the physical market for bars, coins and jewellery, particularly in key consumer nations like China and India.
A late March article in the South China Morning Post noted that gold jewellery sales at big urban retailers in China had more than doubled during the Lunar New Year holiday compared with sales figures in 2020, while jewellers in India were expecting to see solid demand lasting until May at the earliest.
Here at The Perth Mint, we are seeing extremely high levels of demand for minted gold and silver bars and coins, which are the products favoured by retail investors who want to physically hold their precious metal investments (versus using our Depository or ETFs like ASX:PMGOLD which also offer gold price exposure).
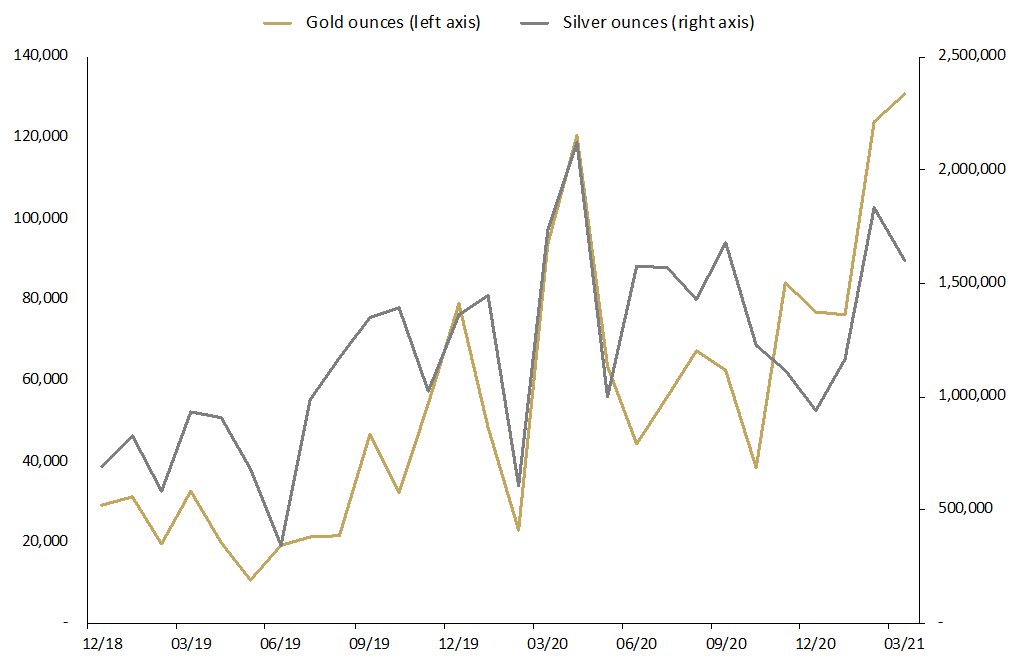
In March, The Perth Mint sold more than 130,000 troy ounces of gold and almost 1.6 million troy ounces of silver in minted product form, which was shipped to clients worldwide. These figures are 285% higher (gold) and 178% higher (silver) than average monthly sales dating back to 2012.
For Q1 2021, The Perth Mint sold more than 330,000 troy ounces of gold and more than 4.5 million troy ounces of silver in minted product form. These figures represent the highest calendar quarter on record for gold and the fourth highest calendar quarter on record for silver.
Troy ounces of gold and silver sold as coins and minted bars
December 2018 to March 2021
Outlook for gold - sentiment couldn’t be worse
One factor that may encourage precious metal bulls is the fact that sentiment readings toward gold in particular are incredibly depressed. Almost no one in the mainstream financial media is bullish about gold right now, while many are almost outright mocking gold as an investment.
This was perhaps best encapsulated in a Bloomberg update from early April, which stated that it was “time to officially bury Goldbug Macro”. The article noted that despite the fact the US Federal Reserve has seen its balance sheet rise from under USD 3 trillion to almost USD 8 trillion in the last 10 years, the gold price is only up about 10% in US dollar terms.
It also noted how benign official inflationary pressures have been over this time period, with the author noting that: “After two huge crises in just over a decade, plus fiscal and monetary stimulus the likes of which we haven't seen before, we now have enough evidence to bury the economic fantasies of gold's most ardent believers.”
This is exactly the kind of commentary one expects to see toward the end of a correction, not just in gold but in any asset class. No one would have felt confident printing an article like that back in August 2020 when the gold price was above USD 2,050 per troy ounce, sentiment was red hot, and analysts were tripping over themselves to publish ever higher price forecasts.
The Bloomberg article isn’t the only example of how bad sentiment toward precious metals is today. In early March, an article titled Gold Timers Are Finally Throwing in the Towel was published on thestreet.com.
Author Mark Hulbert opened the article with the following statement (bold emphasis ours): “Take heart, long-suffering gold traders: A sustainable rally is getting close. I base this forecast on a contrarian analysis of sentiment among several dozen gold market timers. Collectively, they are now more pessimistic than at almost any other time over the past two decades.”
Hulbert’s insights were backed by data from Sentimenttrader.com, which also suggested the market was more bearish on gold by late March 2021 than it had been at any point in the past 20 years.
Combine this with technical readings that also suggest the market is deeply oversold, and it is little wonder contrarian investors are now busy adding to their precious metal positions.
ARTICLES OF INTEREST
thestreet.com/investing/gold-timers-are-finally-throwing-in-the-towel
https://www.fxstreet.com/analysis/weakest-start-to-the-year-for-gold-for-twenty-years-202104050840
gold.org/goldhub/gold-focus/2021/03/gold-commodities-and-reflation
DISCLAIMER
Past performance does not guarantee future results. The information in this article and the links provided are for general information only and should not be taken as constituting professional advice from The Perth Mint. The Perth Mint is not a financial adviser. You should consider seeking independent financial advice to check how the information in this article relates to your unique circumstances. All data, including prices, quotes, valuations and statistics included have been obtained from sources The Perth Mint deems to be reliable, but we do not guarantee their accuracy or completeness. The Perth Mint is not liable for any loss caused, whether due to negligence or otherwise, arising from the use of, or reliance on, the information provided directly or indirectly, by use of this article.


