


Gold corrects as markets look to US election

The gold price fell by more than 3.50% in US dollar (USD) terms during September, undergoing an overdue correction after the explosive gains seen earlier in the year. Long term, the outlook for precious metals remains positive with a range of macro-economic and monetary factors driving investors toward precious metals.
In summary for September 2020:
- The gold price fell by more than 3.50% in USD terms during September, finishing the month at USD 1,886.90/oz.
- In Australian dollar (AUD) terms the gold price was basically flat, finishing the month trading at AUD 2,654.62/oz.
- The decline in the AUD, which fell by 3.35% vs the USD and finished the month at USD 0.7108, mitigated losses for local investors.
- Silver fell by more than 15% in USD terms, pushing the gold to silver ratio to 79.
- Rising real yields and an increase in the USD index helped drive the correction in precious metals.
- ETF inflows continued, but at a much slower pace, whilst managed money investors reduced their long exposure in the second half of the month.
- The outlook for financial markets is likely to remain uncertain in the lead up to the US Presidential Election in early November.
Full monthly review – September 2020
The gold market continued its correction from the all-time highs seen in early August, when the precious metal traded at more than USD 2,050 per troy ounce, to drop by more than 3% during September.
Silver was hit even harder, falling by more than 15% in USD terms to close the month trading just below USD 24.00 per troy ounce. Despite the pullback, silver prices are still almost double what they were in March 2020. The gold to silver ratio finished September at 79.
There were at least three primary contributors to the decline in precious metal prices seen during September.
Rising USD
The USD index increased by more than 2.50% at one stage though it gave up some of this gain to close the month up by 1.9%. This contributed to the pullback in gold, which often struggles in environments where the greenback is rallying.
Growth in real yields
Whilst bond yields remain negative in real terms across most of the developed world, they did manage to rise during September. The table below highlights the real yields on US Treasuries of various maturities from five years to 30 years as at 31 August and 30 September 2020, as well as the movement across the month.
Maturity
31 August
30 September
Change
5 year
-1.41%
-1.22%
+0.19%
7 year
-1.27%
-1.11%
+0.16%
10 year
-1.08%
-0.94%
+0.14%
20 year
-0.64%
-0.54%
+0.10%
30 year
-0.35%
-0.32%
+0.03%
Source: US Department of the Treasury
Long term, negative real yields on sovereign debt are likely to remain one of the key factors driving increased strategic asset allocations to gold. Short term, any increases in real yields can act as a headwind, particularly when that increase is driven by declining inflation expectations, which is what transpired during September.
Loss of momentum
Another factor contributing to the pullback in precious metals was a simple loss of momentum, with gold, and silver to an even stronger degree, unable to maintain the blistering pace of price gains seen this year.
It was inevitable that this would happen eventually, as no market goes up in a straight line. Indeed, it is a healthy part of any bull market to go through corrective periods, with what we believe was an overdue correction in gold explored in more detail below.
Cracks in other markets appearing
Precious metals were not the only market to correct during September, with global equities also pulling back. The S&P 500 dropped by more than 7.5% at one point, though pared some of the losses to close the month down by approximately 4%. The ASX 200 in Australia experienced a correction of similar magnitude.
Market drivers included concerns regarding the stimulus package being debated in Washington, uncertainty surrounding the upcoming US Presidential Election, and growing fears that the spread of COVID-19 is again accelerating in parts of the Northern Hemisphere.
Gold correction was overdue
For some time now, we have been warning of the potential for a correction in the gold price. The market rallied very strongly from under USD 1,200 per troy ounce in September 2018 to more than USD 2,050 per troy ounce in August 2020, an increase of almost 75%.
By August 2020, the gold price was trading 26% above its 200-day moving average (200DmA), which was a warning sign that some short-term froth was evident in the market.
To highlight this, consider the chart below, which displays the USD spot price of gold from December 1999 to the end of September 2020 (gold line). It also shows how far the gold price was trading above or below its 200DMA (black line) on any given day over this period.
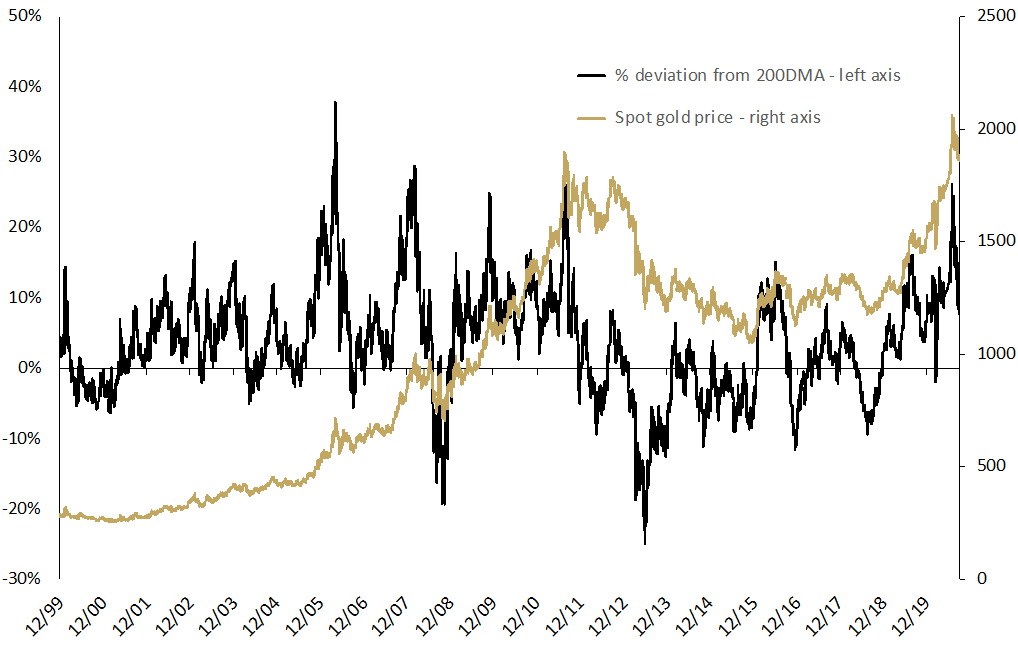
Source: The Perth Mint, Reuters
As you can see, there have been several occasions across the past 20 years where the gold price traded at 20% or more above its 200DMA. These have typically been short lived, with the market generally giving back some of these gains in a period of consolidation.
The table below highlights this clearly, showing the previous periods where gold was trading at more than 20% above its 200DMA, the gold price at the time, and the three-month and three-year returns that followed.
Date
% above 200DMA
USD gold price
3-month return
3-year return
11 May 2006
38%
718.80
-12.0%
27.0%
3 Mar 2008
28%
983.40
-10.5%
44.0%
3 Dec 2009
24%
1,210.60
-5.9%
41.7%
22 Aug 2011
29%
1,897.10
-10.5%
-32.5%
6 Aug 2020
26%
2,067.15
-8.7%*
?
Source: The Perth Mint, Reuters
*This figure represents the gold correction from 6 August 2020 to 30 September 2020. The three-month return will not be known until 6 November 2020.
The table makes it clear that on every prior occasion that gold was trading at more than 20% above its 200DMA, the price fell in the following three months, resulting in an average pullback of almost 10%.
Those corrections typically proved to be good times for investors to add to their precious metal holdings. As the table demonstrates, the gold price generally increased in the three years following on from these strong rallies. The only exception of course was what happened after 2011, with gold priced in USD falling into a bear market that carried on until the end of 2015.
Whilst there are no guarantees, the economic, monetary and financial market environment investors face today is vastly more supportive of gold than it was in 2011.
Given this, there is a reasonable chance that the current pullback we are seeing in gold is similar to those we saw in 2006, 2008 and 2009.
Investors continue to acquire precious metals
Investors continued to allocate to precious metals in September, albeit at a slower pace than we’ve been accustomed to for most of 2020.
Perth Mint minted gold bar and coin sales totalled just over 62,000 ounces. While this is a long way short of the sales numbers seen in March and April (when we sold 93,775 and 120,504 ounces respectively), it is still more than 50% higher than the average monthly sales reported between mid-2012 and 2019.
Global gold ETF holdings increased by 47.49 tonnes (data to 25 September only), a sharp slowdown compared to the first eight months of the year which saw average inflows of almost 120 tonnes per month.
This trend has also been experienced in Australia, with Perth Mint Gold (ASX:PMGOLD) holdings increasing by just over 1% in September. It had grown by more than 70% in the eight months to end August.
In the futures market, managed money longs (those betting the gold price will rise) reduced their exposure in the second half of the month, with positions falling from 166,571 contracts as at 15 September to just 140,320 contracts by September 29. This position changing will have contributed to the decline in the gold price we saw in mid to late September.
Outlook
A period of heightened volatility in precious metals and other markets would not be unexpected in the weeks ahead, with multiple risk factors at play.
The first of these is the US Presidential Election, which is due to take place on 3 November 2020. While the polls and betting markets continue to favour Joe Biden and the Democratic Party, much could change in the next four weeks, especially with news in early October that US President Donald Trump and his wife have fallen ill with COVID-19.
The threat from COVID-19 is obviously not limited to the White House, with the spread of the virus appearing to accelerate recently in parts of Europe and North America. Should the situation continue to deteriorate, not only will global growth figures again be revised down, but policymakers will be under even more pressure to deliver another round of fiscal and monetary stimulus.
Given this backdrop, we would not be surprised to see continued demand for precious metals from investors wanting to diversify their portfolios, even if gold and silver prices themselves continue to correct or trade sideways in the coming weeks.
DISCLAIMER
Past performance does not guarantee future results. The information in this article and the links provided are for general information only and should not be taken as constituting professional advice from The Perth Mint. The Perth Mint is not a financial adviser. You should consider seeking independent financial advice to check how the information in this article relates to your unique circumstances. All data, including prices, quotes, valuations and statistics included have been obtained from sources The Perth Mint deems to be reliable, but we do not guarantee their accuracy or completeness. The Perth Mint is not liable for any loss caused, whether due to negligence or otherwise, arising from the use of, or reliance on, the information provided directly or indirectly, by use of this article.


