


Gold performance over the last 20 years

2020 was a positive year for precious metal bulls, with the price of gold hitting all-time highs in USD terms, when it traded above USD 2,050 per troy ounce in August last year.
Strong gains were seen in almost every major currency with the price trading above AUD 2,800 per troy ounce, before a correction in the gold price, and a rally in the value of the AUD saw the precious metal pull back.
Gold finished 2020 trading at 1891.10 and 2455.30 per troy ounce in USD and AUD respectively, with these prices representing gains of 24.8% (USD terms) and 13.9% (AUD terms) across the full calendar year.
Whilst that is a very solid return, it is not unexpected given the historical average returns gold has delivered during the type of interest rate environment investors find themselves in today.
The chart below highlights end of calendar year prices for gold in both currencies from 1999 through to the end of 2020.
Gold price from 1999-2020 (AUD and USD)
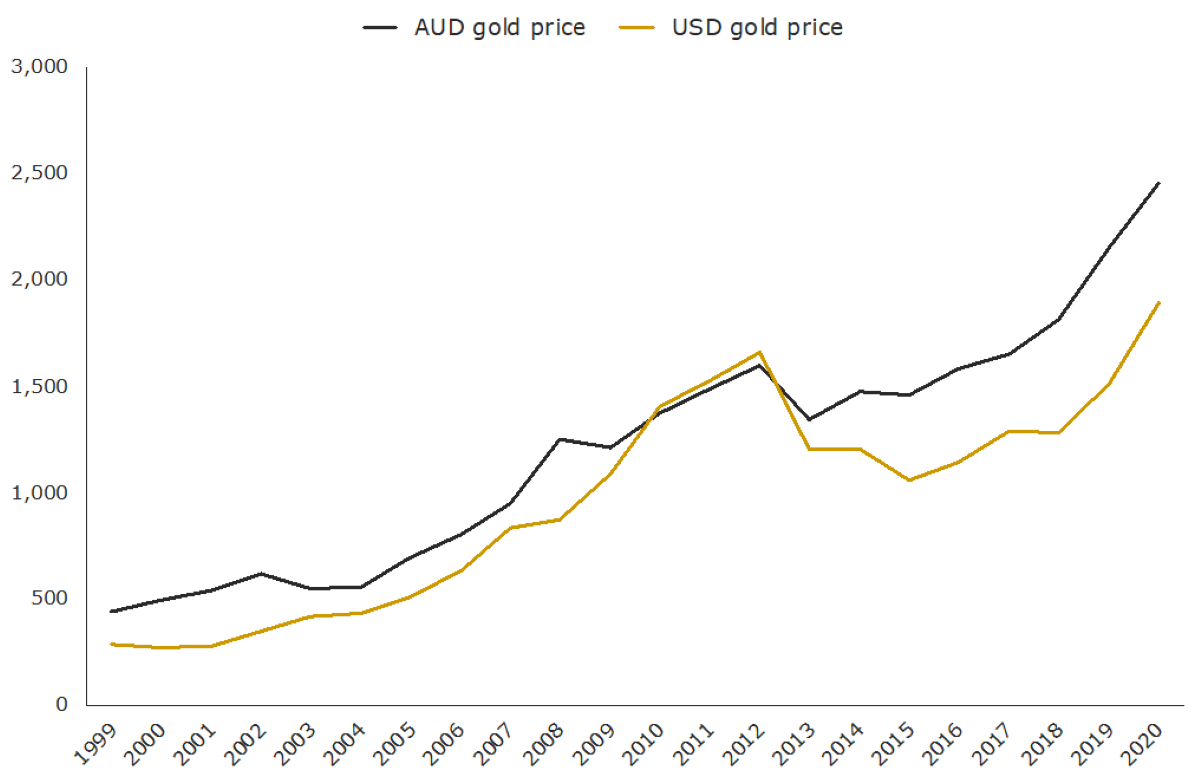
Source: The Perth Mint, World Gold Council, LBMA, RBA
Despite these substantial returns, it’s important to remember that gold, like most asset classes, has years of very strong performance, years where performance is modest, and indeed years where performance is negative.
The table below illustrates this, highlighting end of year gold prices in both USD and AUD, and calendar year returns across the last 20 years.
Gold prices and returns from 1999-2020
Year
AUD gold price
USD gold price
AUD gold price annual % return
USD gold price annual % return
1999
443.5
290.3
![]()
![]()
2000
493.9
274.5
11.3
- 5.4
2001
540.1
276.5
9.4
0.7
2002
616.6
347.2
14.2
25.6
2003
552.5
416.3
-10.4
19.9
2004
555.7
435.6
0.6
4.6
2005
699.3
513
25.9
17.8
2006
801.8
632
14.7
23.2
2007
949.6
833.8
18.4
31.9
2008
1247.5
869.8
31.4
4.3
2009
1209.2
1087.5
-3.1
25.0
2010
1371.2
1405.5
13.4
29.2
2011
1493.4
1531
8.9
8.9
2012
1596.5
1657.5
6.9
8.3
2013
1346.3
1204.5
-15.7
-27.3
2014
1473.7
1206
9.5
0.1
2015
1456.9
1060
-1.1
-12.1
2016
1582.5
1145.9
8.6
8.1
2017
1650.6
1291
4.3
12.7
2018
1816.8
1279
10.1
-0.9
2019
2154.9
1514.8
18.6
18.4
2020
2455.3
1891.1
13.9
24.8
Source: The Perth Mint, World Gold Council, LBMA, RBA
In any given year, you might find that your investment goes backward (like in 2013), years where it more or less trades sideways (2004 in AUD terms and 2014 in USD terms), and years where gold streaks higher (2005).
Long-term investors have been well rewarded, with the price of gold rising by 551% (USD terms) and 454% (AUD terms) over the entirety of the last 20 years to the end of 2020. These returns mean that gold has been one of the best performing asset classes of the new millennium.
Looking ahead, there remain multiple tailwinds which should support gold in 2021 and beyond. These include:
- Record low interest rates around the world
- Central banks continuing to engage in Quantitative Easing
- Large parts of the fixed income world offering negative real yields
- Equity markets trading at historically elevated multiples of sales and earnings
- The continued uncertainty caused by COVID-19.
Whilst there is no guarantee, these factors should see continued demand for gold and have a positive impact on gold prices in the years to come.


