Gold and silver correct as markets look to vaccine news

Precious metal prices dropped sharply toward the end of November, with the USD price of gold falling by more than 6% across the month. This was spurred by investor optimism about development of COVID-19 vaccines, which helped drive global stock markets to all-time highs.
What happened in precious metal markets in November?
- The gold price fell by more than 6% in USD terms in November, ending the month trading at USD 1,762.55/oz.
- In AUD terms, gold dropped 11% to end the month below AUD 2,400/oz. A sharp rally in the value of the AUD contributed to the pullback.
- Silver also declined by 6% during November, with the gold silver ratio ending the month at 79.
- The precious metal pullback occurred despite weakness in the USD (-2.18%) and falling real bond yields, developments which are typically supportive of bullion prices.
- Global equity markets rose by more than 13%, their strongest monthly gain ever, as optimism regarding COVID-19 vaccines drove risk-on appetites.
- Cryptocurrency markets also roared higher in November, with Bitcoin rising by 40%, ending the month near all-time highs just below USD 20,000 per coin
- Gold is now sitting at a much healthier level from a technical perspective after the recent pullback, with multiple tailwinds to support prices as we head toward 2021.
Full monthly review – November 2020
Gold and silver prices fell by more than 6% during November, with the two metals ending the month trading at USD 1,762.6/oz and USD 22.20/oz respectively.
Since trading at their calendar year highs in August, which was also an all-time high in nominal terms for gold, the two metals have pulled back by 15% (gold) and 23% (silver).
This has had an inevitable impact on demand, with flows into precious metal ETFs including Perth Mint Gold (ASX:PMGOLD) turning negative for the first time this year.
Since the US Presidential election, investors have well and truly embraced a risk-on position. Some see signs of a mania building, with warning signs including:
- An almost record monthly increase in the MSCI All World Index, which rose by 13% in November.
- The S&P 500 price to sales ratio climbing to 2.69, 14% higher than its reading in 2000, and more than 200% above the lows seen during the depths of the GFC.
- The Dow Jones index climbing above 30,000 points for the first time ever.
- Huge inflows into equity markets, with analysis in the Financial Times suggesting more money flowed into equity market funds in the week following Pfizer announcing successful COVID-19 vaccine results than in any week in at least two decades.
- The price of Bitcoin soaring approximately 40%, closing in on a new all-time high above USD 20,000 per coin.
- CNN’s Fear and Greed index flipping from showing extreme fear a month ago to showing extreme greed.
- A 13% increase the S&P Goldman Sachs commodity index as markets price in higher rates of growth as we head toward 2021.
The primary cause of the optimism that has swept across investment markets in the past few weeks has been the positive news regarding the development of multiple COVID-19 vaccines. Barring any mishaps, these look set to roll-out in the weeks and months ahead.
COVID-19 vaccines have not been the only factor though, with markets warming to reassurances from central bankers around the world who have promised not to take away the monetary punchbowl anytime soon, even if growth bounces back faster than expected.
Financial markets have also reacted positively to the news that ex-US Federal Reserve Chair Janet Yellen is soon to take over as US Treasury Secretary. This bodes well for what is shaping up as an inevitable merging of fiscal and monetary policy in the years ahead.
Below, we delve into three areas of relevance to precious metals investors and explain why we remain optimistic about the outlook heading into 2021, especially after the much-needed correction gold and silver have been through these past few months.
Real yields and the USD didn’t help gold this time
Some precious metal bulls will have been troubled by the fact that gold sold off aggressively during November, despite a fall in real yields and a decline in the USD.
As per the table below, real yields fell by roughly 10 basis points across the maturity spectrum in November, with the decline driven by both a minor decrease in nominal bond yields themselves, as well as slight uptick in inflation expectations.
Date
5 year
7 year
10 year
20 year
30 year
End Oct
-1.21
-1.04
-0.82
-0.42
-0.23
End Nov
-1.32
-1.13
-0.93
-0.55
-0.35
Source: The Perth Mint, United States Treasury
Typically, one would expect gold to rise as real yields fall, as this reduces the opportunity cost of investing in the precious metal, but that did not happen during November.
Alongside the decline in real yields, the USD index (DXY) fell by more than 2% in November. Many investors see gold as an anti-USD play. History does bear this out to a degree, though the relationship isn’t as simple as USD up, gold down, or USD down, gold up, as some would have you believe.
This is demonstrated in the table below, which looks at monthly returns for the DXY and the USD spot gold price in environments where the DXY is rising and falling.
Note that we have measured the relationship between gold and the DXY over three time periods, all ending in November 2020:
- From 1971 when the United States formally abandoned the gold standard;
- From the end of 1999 when the secular bull market in precious metals started; and
- From the end of 2015 when the cyclical correction in gold, which saw the precious metal fall below USD 1,100/oz, came to an end.
US dollar rising
Summary
Since 1971
Since 1999
Since 2015
Number of months USD rose
291
123
30
Average return - rising USD
1.90%
1.78%
1.24%
Average return - gold
-0.75
-0.63%
-0.50%
How frequently gold falls
62%
59%
67%
US dollar falling
Summary
Since 1971
Since 1999
Since 2015
Number of months USD fell
306
128
29
Average return - falling USD
-1.83%
-1.74%
-1.49%
Average return - gold
2.30%
2.24%
2.43%
How frequently gold rises
66%
71%
79%
Source: The Perth Mint, Reuters
The table is telling us that:
- The USD is as likely to rise as it is to fall in any given month, with the average move to the upside and downside quite similar. As an example, since 1999 DXY has risen in 123 months (+1.78% average gain) and fallen in 128 months (-1.74% average loss).
- Gold tends to prosper far more in falling USD environments than it suffers during rising USD environments. As an example, it has delivered average gains of +2.43% in months the USD has fallen since 2015, yet only suffered average declines of -0.50% in months that USD has risen.
- While gold does tend to fall when the USD rises and increase in value when the USD falls, it doesn’t always behave in this manner. For example, from 1971 onward, gold has increased 66% of the time the USD falls, meaning there is a more than three in 10 chance gold will fall in months that the USD falls.
This is exactly what transpired in November 2020.
Optimism regarding COVID-19 vaccines and the record rally in risk assets which pushed global stock markets to all-time highs combined to push gold lower, even though the USD and real yields were falling.
Gold to silver ratio – the big picture
Silver is often seen as a high-beta version of gold, outperforming to the upside and underperforming to the downside. It also displays significantly higher price volatility, owing to its quasi-monetary, quasi-industrial metal status.
In April 2020, the gold to silver ratio (GSR) peaked just above 110, meaning one ounce of gold could buy 110 ounces of silver. By August, the GSR had fallen to 71, when gold was hitting all-time highs, before rising back toward 80 by the end of September.
Despite the sell-off in precious metals in the two months since, the GSR has essentially remained static, ending November just below 80.
For precious metal bulls, the fact that silver has held its ground relative to gold over this period, and during November in particular, is an encouraging sign that precious metals are approaching the end of the corrective cycle that began in mid-August.
A look at the GSR over a longer term also tells an important story when it comes to precious metals, and developments in the economy and financial markets more broadly.
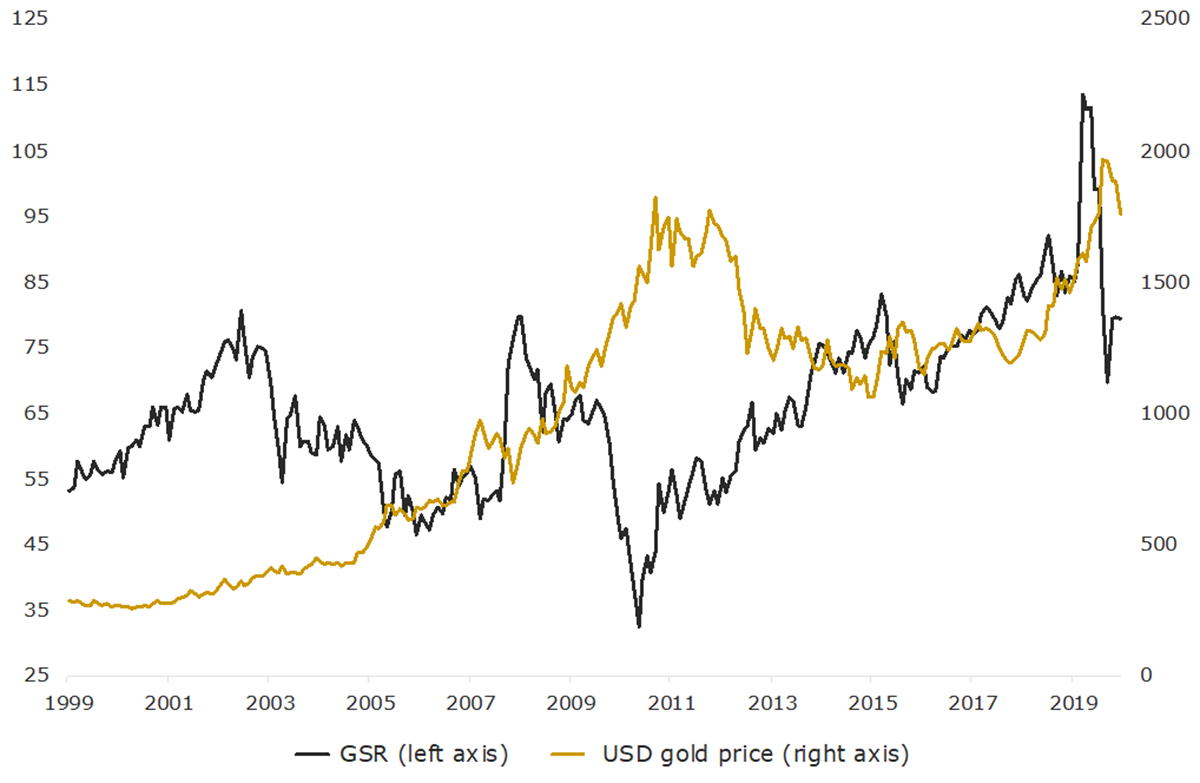
The chart below highlights movements in the GSR, as well as the USD spot gold price since December 1999.
Gold to silver ratio and USD spot price of gold
 Source: The Perth Mint, Reuters
While gold has risen from under USD 300/oz to over USD 1750/oz during this period, the GSR has moved in a wide range. It ended 1999 sitting at 53, hit a low of 33 in April 2011, and then peaked above 110 earlier this year.
The table below highlights the gold and silver price, as well as the GSR at some of the key points over the past two decades.
Gold and silver prices plus GSR
Date
USD gold price (oz)
USD silver price (oz)
GSR
31 Dec 1999
287.80
5.40
53
30 Dec 2008
872.55
10.95
80
30 April 2011
1,563.60
47.95
33
30 April 2020
1,711.30
15.34
112
30 Nov 2020
1762.55
22.15
80
Source: The Perth Mint, Reuters
The above chart and table, which highlight the nine years of silver price underperformance relative to gold leading into April 2020, also neatly captures four of the primary economic and financial market trends that have dominated the post-GFC era.
These include the bear market in commodities, the record outperformance of financial assets vs hard assets, low rates of economic growth in the developed world and minimal inflation levels as measured by increases in CPI.
Any one of those developments would be expected to hold back the performance of precious metals, especially silver. The fact that all four were at play, and so persistently for most of the past decade, explains the extreme underperformance of silver relative to gold.
Looking forward, the chart also makes it apparent that silver looks set to outperform gold, with markets beginning to price in expectations of higher economic growth and inflation.
Should that come to fruition, it will likely be supportive of the entire precious metals complex.
Textbook correction over as market looks toward 2021?
Another positive sign for the precious metal market is the unwind of speculative froth that had been building as gold roared above USD 2,050/oz in early August 2020.
Back then, investors were piling into gold ETFs at a record pace and media coverage was overwhelmingly bullish, with some analysts issuing price targets of USD 3,000/oz and above.
As prices have fallen, the mood of the market has become far more subdued, while investors have begun lightening their gold exposure. Long positions in the gold futures market, for example, are now 25% lower than they were in late July.
We also saw outflows from gold ETFs in November (the first month in 2020 that total holdings declined), while technical readings like RSI had fallen into oversold territory by the end of last month.
Importantly, the correction that we have seen in the gold price since the highs in August has brought the precious metal all the way back to its 200-day moving average (200DMA).
This is something we had suggested may occur based on historic market patterns. The past 20 years of market data made it clear that every time the gold price had risen so fast that it was trading at 20% or more above its 200DMA, as it was in August, a correction soon followed.
Those corrections on average typically saw the gold price fall by 10% or more over a period of a few months, often trending back to, or just below, its 200DMA.
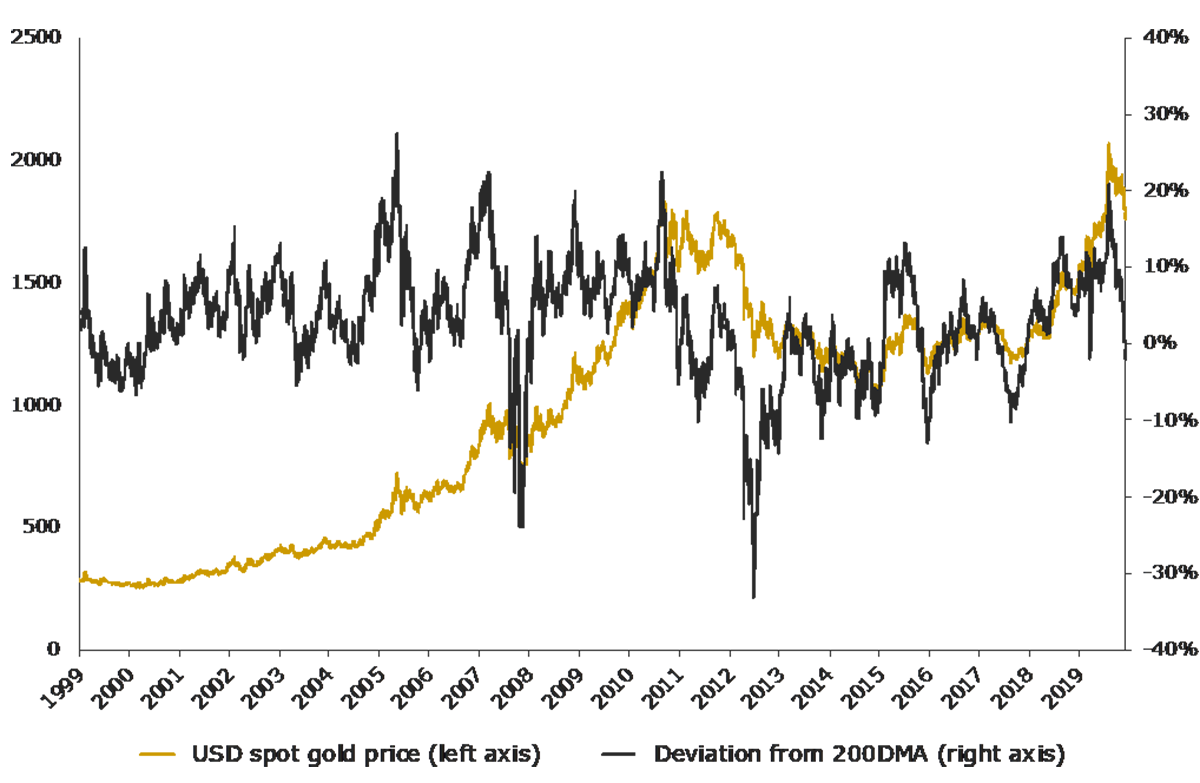
The chart below, which tracks data to the end of November, illustrates this. It displays the USD spot price of gold as well as how far the gold price was trading above or below its 200DMA on any given day.
USD spot price of gold and deviation from 200 Day Moving average (DMA)
Source: The Perth Mint, Reuters
Based on this data, and the market patterns it highlights, we can say that the 15% pullback that we have seen in the USD gold price since August so far represents a textbook correction that has played out perfectly from a technical perspective.
This is not to say definitively that the lows seen in late November will mark the bottom of this corrective cycle for gold. Nevertheless, it is reasonable to observe that at this stage there is nothing in the charts or recent price action that suggests the primary bull market uptrend is over.
With the market now sitting at a much healthier level, and with the recent investor overexuberance gone, now would appear to mark a safer entry point for medium to long-term investors looking to initiate or add to their precious metal positions.
With monetary and fiscal policy likely to remain loose for years to come, and financial markets at or near record highs, there are no shortage of tailwinds for gold and silver as we head towards 2021.
This will likely prove especially true if there any further COVID-19 flare ups or hiccups in rolling out vaccines.
DISCLAIMER
Past performance does not guarantee future results. The information in this article and the links provided are for general information only and should not be taken as constituting professional advice from The Perth Mint. The Perth Mint is not a financial adviser. You should consider seeking independent financial advice to check how the information in this article relates to your unique circumstances. All data, including prices, quotes, valuations and statistics included have been obtained from sources The Perth Mint deems to be reliable, but we do not guarantee their accuracy or completeness. The Perth Mint is not liable for any loss caused, whether due to negligence or otherwise, arising from the use of, or reliance on, the information provided directly or indirectly, by use of this article.