


Gold rallies as Delta fears grow
Gold prices rose by almost 4% during July as fears over the spread of the COVID-19 Delta variant helped push bond yields lower. Despite the rally, the precious metal remains range bound around USD 1,800 per troy ounce, with the market awaiting a decisive catalyst to determine whether we see more short-term weakness, or a move back to all-time highs later in the year.
Summary of market moves:
- Gold prices rallied by 3.6% in US dollar terms during July, with the precious metal ending the month trading back above USD 1,820 per troy ounce.
- The strength in gold did not translate to silver, which fell by 1.1% across the month.
- Continued weakness in the Australian dollar, which fell 1.8% to USD 0.738, helped push the local gold price up by 5.5% for the month.
Stock markets continued to climb higher, with the S&P 500 up another 2.3% during July. It has now almost doubled since the lows seen in March 2020. - Yields fell sharply during July, with US 10-year Treasuries ending the month yielding just 1.24% (-1.17% real), down from 1.45% (-0.87%. real) at the end of June.
- Cryptocurrency markets rallied with the price of Bitcoin rising by 14% in July to end the month back above USD 40,000 per coin.
Full report - July 2021
Gold prices rallied by almost 4% in US dollar terms during July, with the precious metal finishing the month trading at USD 1,825 per troy ounce.
A decline in both nominal and real yields, combined with rising fears about the spread of the Delta variant of COVID-19, supported gold during the month, though it did not translate to higher prices across the entire precious metal complex, with silver (-1.1%), platinum (-1.4%) and palladium (-1.8%) all falling in US dollar terms.
Australian dollar investors fared better than their US counterparts, with gold ending the month trading back above AUD 2,450 per troy ounce, up more than 5% during July and now positive on a calendar year to date basis.
Despite the bounce, gold remains range bound, with the market looking for a catalyst to move it decisively in either direction. On the positive side, higher rates of inflation, falling bond yields, central bank buying, and pandemic related threats are expected to provide support.
On the negative side, the market’s apparent belief that inflationary pressures are likely to prove transitory, and continued strength in equity markets, are holding back safe haven demand.
We explore some of these factors in more detail below.
Why isn’t gold higher?
Despite the bounce in July, some commentators argue that gold is underperforming at present, with higher than expected inflation and declining real yields failing to propel the precious metal back toward USD 2,000 per troy ounce as yet.
The below table, which shows the gold price and real yields on the day gold hit all-time highs in August 2020, at its lowest point in 2021 and again at the end of July, illustrates their point.
US dollar gold price and real yields on US Treasuries
Date
5 year yield
10 year yield
20 year yield
30 year yield
USD gold price
06/08/2020
-1.32%
-1.08%
-0.72%
-0.45%
2,067oz
31/03/2021
-1.62%
-0.63%
-0.13%
0.10%
1,684oz
31/07/2021
-1.87%
-1.17%
-0.64%
-0.36%
1,826oz
Source: LBMA, United States Treasury
The table highlights the fact that real yields rose (though remained negative out to 20-year bonds) between August last year and March 2021, which in part explained the almost 20% decline in the gold price over that time period.
Since the end of March though, real yields for bonds of all maturities have again fallen and are now lower for 5- and 10-year bonds compared to where they were back in late August.
Despite this, gold currently remains more than USD 200 per troy ounce below the August 2020 high.
Two primary factors are responsible for this. The first centres around the belief widely held in the market today that currently high rates of consumer price inflation will prove transitory. (US CPI was +4.2% in April, +5.0% in May, and +5.4% in June.)
This theory is supported by belief that much of the inflationary pressure evident in the market is driven by a combination of:
- base effects - for example energy prices, which had cratered in the first half of 2020, up 25% in the year to end June.
- supply chain disruption - with COVID-19 related shutdowns creating bottlenecks in the global economy that have led to short-term price spikes that will ease over time.
As evidence of the supposedly transitory nature of the current surge in inflation, commentators are pointing to the fact that median CPI has increased by just 2.2% in the last year.
This means that the difference between overall CPI and median CPI is now over 3%, the largest gap in the last 20 years, with the annual changes in both inflation measurements seen in the chart below.
Annual change (%) in overall CPI and median CPI
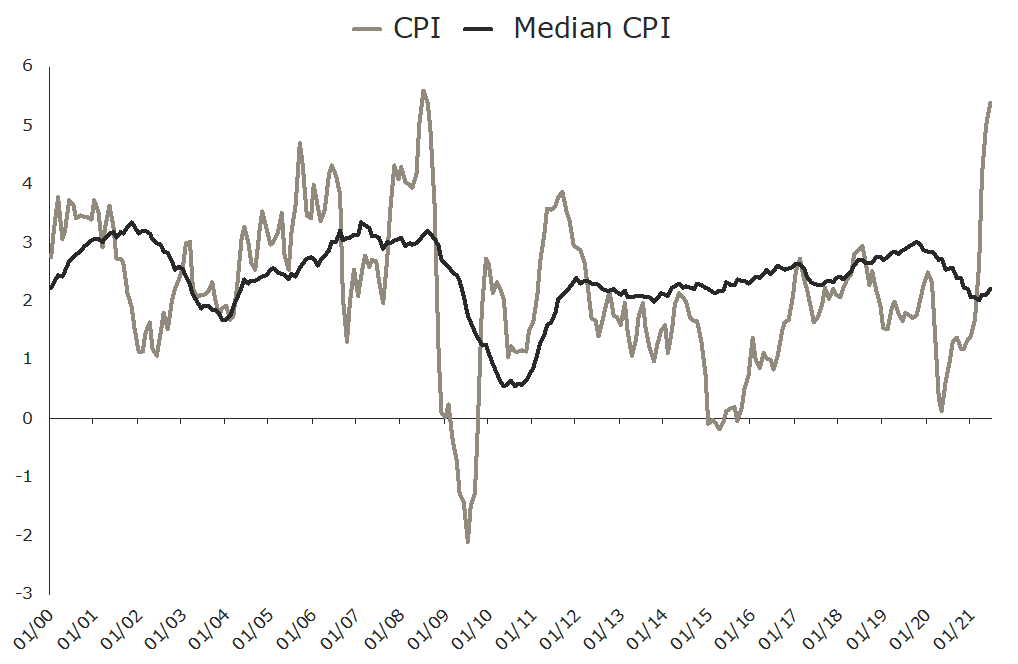
Source: Federal Reserve Bank of Cleveland
Irrespective of whether one personally agrees with the above argument, there is little doubt that it is the predominant narrative in the market today.
As the market doesn’t perceive inflation to be a sustained threat, it helps explain why gold, which is typically highly sought after as an inflation hedge, is yet to move higher.
The second, and arguably more important factor holding gold back right now is momentum, particularly the relative momentum between gold and equities.
While some investors may scratch their heads at how, or why, equity markets continue to push higher, the fact is that they are. Indeed, so powerful is the momentum in equity markets that the S&P 500 is only a couple of percentage points away from doubling since the lows seen in March last year.
As this article highlights, should the market reach that milestone in the coming weeks, it will be by some margin the fastest doubling of stock market lows on record, easily beating the time it took for markets to recover from the crash caused by the Global Financial Crisis just over a decade ago.
On a rolling 12-month basis, the S&P 500 was up 34% in the year to end July, with the past few months seeing some of the best year on year performance for equities on record, something we highlighted in chart form in last month’s report.
We’ve included that chart again below, though this time we have expanded it to include a line (gold coloured on the chart) which shows the price performance of the S&P 500 minus price movements in gold. When the number is above zero it means the S&P 500 is outperforming gold, and when it is below zero it is underperforming gold, on a rolling 12-month basis.
The chart highlights that relative to gold’s rolling 12-month performance, the S&P 500 is outperforming at an almost record pace.
Indeed, the only other times equities have outperformed so significantly was in late 2013 (after gold had crashed in US dollar terms), the late 90s (towards the end of gold’s two decade bear market and a very strong period for stocks), the start of the 1980s (end of the last great bull market in gold), and the mid-1970s (mid-cycle correction for gold).
Rolling annual performance for the S&P 500 and S&P 500 minus gold performance
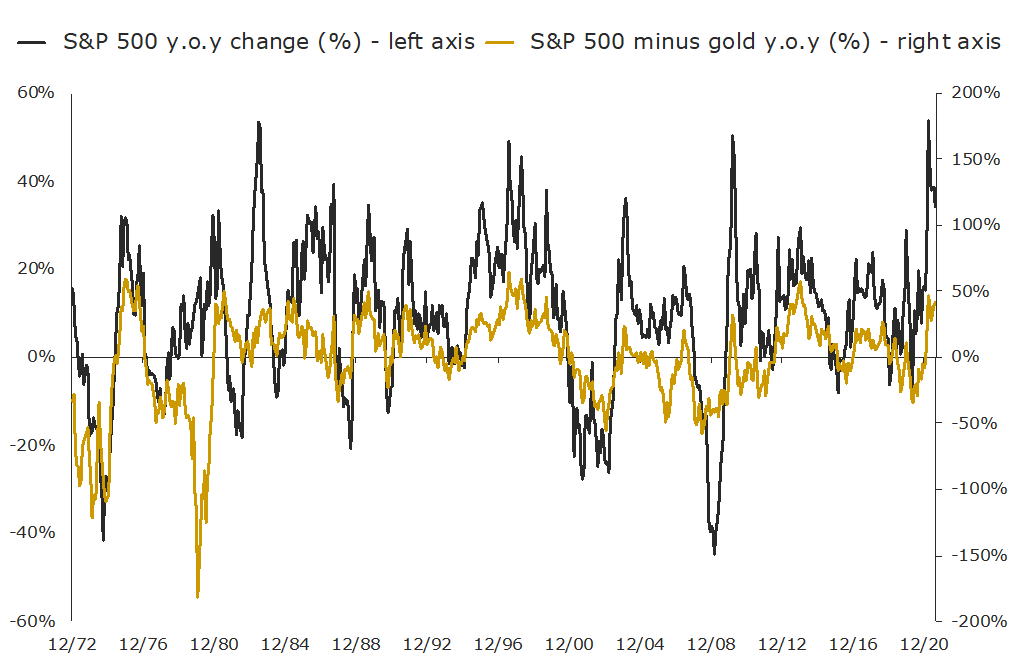
Source: The Perth Mint, LBMA, Bloomberg
Given the overwhelming momentum that is evident in risk assets, it should be no surprise gold has not yet reclaimed the USD 2,000 per troy ounce level, even if real yields across part of the maturity spectrum are in line or even lower than they were back in August last year.
It simply doesn’t have momentum on its side right now.
This is a point that Charlie Morris, the Editor of the Fleet Street Letter and a highly respected precious metal (and crypto) commentator, covered in a 28 July article titled "Why is gold so cheap?".
Charlie’s article included the below chart, which highlights the US dollar gold price and total holdings in gold ETFs plus the net long position amongst speculative gold traders.
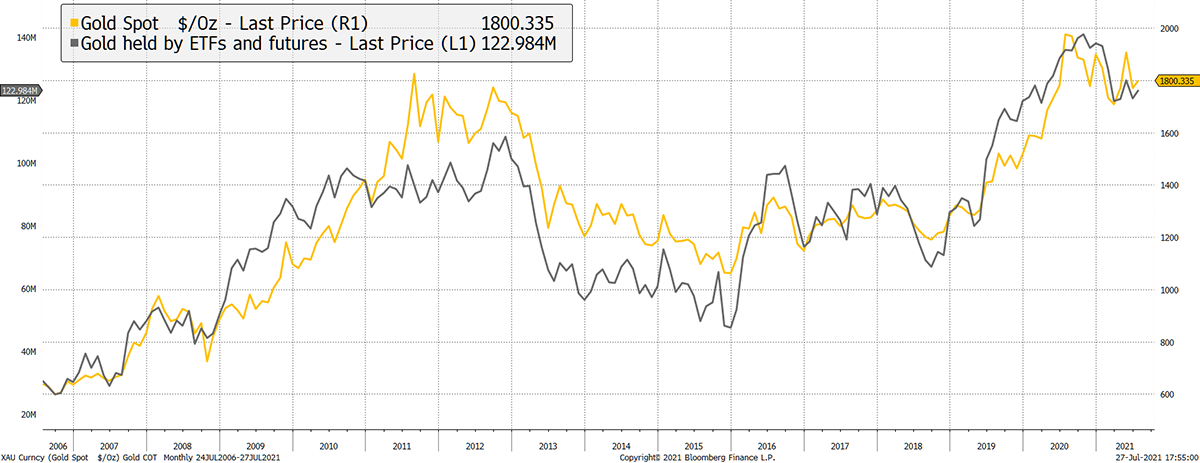
Source: Charlie Morris, Bloomberg
The correlation between the two is very clear, with the chart telling us the appetite for gold amongst developed market investors has waned since August last year, and that this is a key factor holding prices back at present.
Despite this soft patch, there are analysts and investment managers who remain positive on gold’s price trajectory moving forward. These include fund manager Diego Parrilla, who oversees USD 250 million in assets, who recently stated that he thinks “the drivers for gold strength not only remain but actually have been strengthened.”
According to this article, Parrilla holds the opinion that gold may well trade somewhere between USD 3,000 and USD 5,000 per troy ounce in the next three to five years.
Gold demand trends
The World Gold Council (WGC) just released its latest quarterly Gold Demand Trends report, which looked at developments in precious metal markets up until the end of June. Key findings included:
- A 56% year on year increase in bar and coin investment, with strong demand continuing in Western markets.
- A 60% year on year increase in jewellery demand, though this is from the extremely depressed levels seen in Q2 2020, with demand from this segment still 17% lower than the average demand seen between 2015 and 2019 (i.e. pre COVID).
- 200 tonnes of net purchases by central banks, with Thailand, Hungary and Brazil the main buyers. Over the first six months of the year, net purchases have totalled 333 tonnes, the third highest H1 figure in the last decade.
- Modest inflows into gold ETFs, with holdings increasing by just over 40 tonnes across the quarter. While this is positive, it represents a 90% decline relative to the more than 400 tonnes of inflows seen during Q2 2020, with this decline a perfect illustration of the more subdued environment gold finds itself in right now.
Interestingly, the WGC report pointed out that the US dollar gold price averaged 1,816.50 per troy ounce in Q2 2021, which was 6% higher than the average price seen a year ago.
This statistic provides important perspective. While sentiment towards gold is lukewarm at best right now, and the price is currently trading close to 10% below the all-time high seen last August, the fact that the average gold price in Q2 2021 is 6% higher than a year ago illustrates that we are still in a positive environment for the precious metal.
In due course, this is likely to encourage more investors to increase their allocations to gold, especially given the multiple challenges they face today, including:
- Inflationary pressures which continue to build.
- Yields on defensive assets that remain low or negative across the maturity spectrum.
- Risk assets trading at or near all-time highs.
Sentiment will inevitably shift, even if the timing remains unclear. When it does, those with strategic allocations to gold and other precious metals are likely to be rewarded.
DISCLAIMER
Past performance does not guarantee future results. The information in this article and the links provided are for general information only and should not be taken as constituting professional advice from The Perth Mint. The Perth Mint is not a financial adviser. You should consider seeking independent financial advice to check how the information in this article relates to your unique circumstances. All data, including prices, quotes, valuations and statistics included have been obtained from sources The Perth Mint deems to be reliable, but we do not guarantee their accuracy or completeness. The Perth Mint is not liable for any loss caused, whether due to negligence or otherwise, arising from the use of, or reliance on, the information provided directly or indirectly, by use of this article.


