Gold records annual fall despite December rally
Executive summary
- Gold prices ended 2021 on a positive note, closing at USD 1,820 per troy ounce (oz), up 1% during December.
- Despite the small rally, gold experienced a 4% decline in US dollar terms, its first calendar year decline since 2018.
- In Australian dollar terms, gold ended the year trading above AUD 2,500oz, an increase of 2.4%, continuing a string of positive calendar year returns dating back to 2015.
- Silver ended 2021 down 13% at USD 23.1oz, with the gold silver ratio increasing from 71 to 79 over the year.
Gold price remained steady in December
Gold prices continued to trade in a narrow range during December, with the precious metal oscillating around the USD 1,800oz price point for most of the month.
Ending the month at USD 1,820oz, gold fell by 4% for the year, recording its first calendar year decline (in US dollar terms) since 2018, which is seen in the table below.
End of year gold prices and annual returns – 2010 to 2021
Year
USD Gold Price
AUD Gold Price
Price Change (%)- USD Gold Price
Price Change (%)- AUD Gold Price
2010
1405.5
1371.2
-
-
2011
1531.0
1493.4
8.9%
8.9%
2012
1657.5
1596.5
8.3%
6.9%
2013
1204.5
1346.3
-27.3%
-15.7%
2014
1206.0
1473.7
0.1%
9.5%
2015
1060.0
1456.9
-12.1%
1.1%
2016
1145.9
1582.5
8.1%
8.6%
2017
1291.0
1650.6
12.7%
4.3%
2018
1279.0
1816.8
-0.9%
10.1%
2019
1514.8
2154.9
18.4%
18.6%
2020
1887.6
2446.2
24.6%
13.4%
2021
1820.1
2508.4
-3.6%
2.5%
Source: The World Gold Council, The Perth Mint
Despite the minor fall seen last year, gold has rallied by more than 70% in both US and Australian dollar terms since the lows seen in late 2015, making it one of the best performing assets during this period.
What held gold back in 2021?
There were several factors that contributed to the minor price decline seen in gold in 2021. These include:
- A rising US dollar index, which finished the year up 6%.
- The rollout of vaccines across most of the developed world, which reduced investor fears about the potential damage the COVID crisis would have on global economic growth.
- A major upward revision in actual and forecast economic growth, with OECD estimates for global economic growth in 2021 rising from 4.2% to 5.7% across 2021.
- An incredibly strong rally in equities, with the S&P 500 up more than 25%, while global equity strategies resulted in record inflows.
- A continued bull run in digital assets, with Bitcoin prices up 65%, while the market value of all cryptocurrencies rose by 205%.
These factors also helped drive the pullback in silver that we saw in 2021. It needs to be remembered that silver prices rose by almost 50% in 2020 (it was up more than 100% from the intra-year low), which helps explain its underperformance both in absolute terms, and relative to gold in the year gone by.
What went right?
It wasn’t all bad news for gold last year, with a handful of factors supporting the market.
The first of these was stronger consumer demand for gold bars, coins and jewellery. This can be seen in the table below, which highlights the fact total consumer demand in the first three quarters of 2021 was 44% higher than that seen in 2020.
It was also 5% higher than demand levels seen in 2019, before anyone had ever even heard of COVID.
Gold: Consumer demand (tonnes)
![]()
Q1-Q3 2019
Q1-Q3 2020
Q1-Q3 2021
Change (%) 2021 v 2020
Change (%) 2021 v 2019
India
496t
260t
360t
39%
-27%
China
679t
427t
730t
71%
8%
Middle East
177t
124t
154t
24%
-13%
Americas
136t
155t
224t
45%
65%
Europe
143t
219t
240t
10%
68%
Total
1630t
1185t
1709t
44%
5%
Source: The World Gold Council, The Perth Mint
As one of the largest producers of minted products globally, The Perth Mint has witnessed this surging consumer demand first hand, with sales of gold products in minted form topping 1,000,000oz in 2021.
Central bank demand was also robust, with net purchases in H1 2021 topping 330 tonnes, almost 40% above the average of the last five years.
While the pace of gold purchasing eased in the second half of the year, most estimates suggest net purchases by central banks in 2021 will be in the 400-500 tonnes range, with developed markets like Singapore and Ireland now joining the list of nations adding to their gold reserves.
Finally, while gold recorded a calendar year loss, it’s important to note all the pain was seen in Q1 2021, when gold dropped by 10% to end March trading below USD 1,700oz.
From the end of March through to end December, gold trended higher, supported by rising inflation rates and a renewed decline in real bond yields, with daily price action across the year seen in the chart below.
daily gold prices in 2021
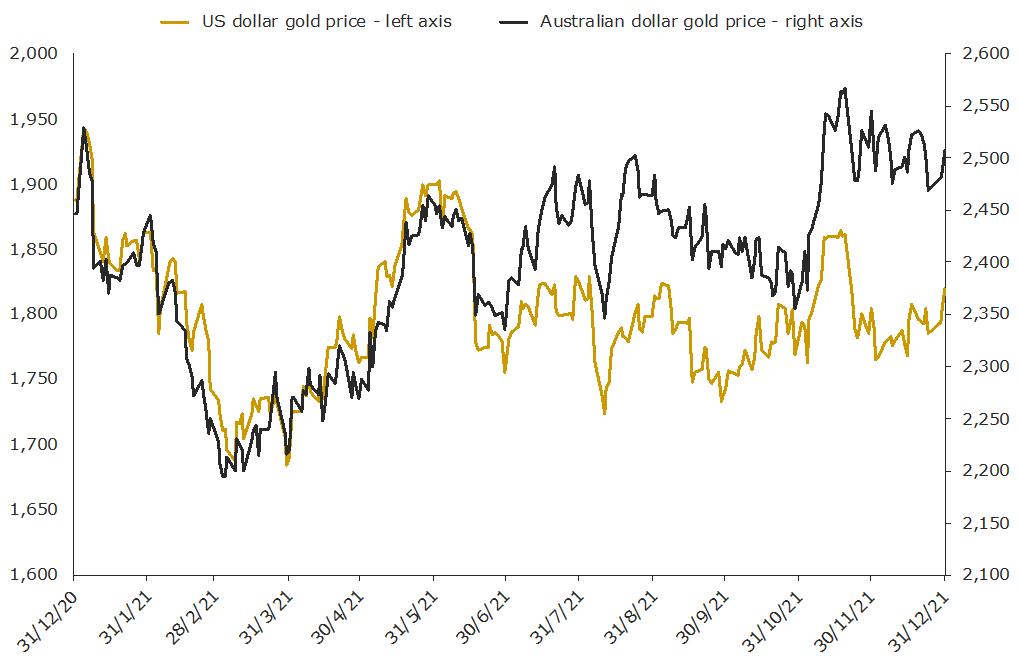 Source: The World Gold Council, The Perth Mint
Outlook for gold in 2022
As 2022 gets underway, gold looks delicately poised, with a range of factors set to influence the market.
On the negative side, the likelihood that US inflation rates will soon decelerate, that we will see up to three interest rate increases (with more to come in 2023), and that the US dollar could continue to push higher, are all potential headwinds for the precious metal.
That said, the fact gold rose in December suggests that the accelerated tapering of asset purchases, and the more hawkish
interest rate projections announced by the US Federal Reserve (Fed) at its December FOMC meeting are already priced in.
On the positive side, gold may see renewed safe haven demand with analysts noting the “potential for higher volatility may push investors to gold as a potential hedge against heightened market risks.”
This may prove to be a particularly relevant driver for gold this year, given;
- the low nominal and negative real yield environment investors face when looking at sovereign debt markets.
- how expensive equity markets (particularly in the United States) are today, with the famous Buffett Indicator showing the market capitalization of US stocks ended 2021 at 218% of US GDP. That’s the highest figure on record, and a full 70% above the long-term average.
Indeed, with markets beginning to show signs of fragility in the face of the withdrawal of policy support, it would not take much to boost gold, with complications caused by the emergence of the far more transmissible Omicron variant (and the lockdown response we are starting to see in parts of Europe), another potential tailwind.
Gold may also benefit given the likelihood we’ll see economic growth fall in the aftermath of the rejection of US President Joe Biden’s two trillion dollar “Build Back Better” plan.
It also has to be noted that while inflation didn’t help gold deliver a positive return in 2021, it’s too early to say the precious metal ‘failed’ as a hedge.
For while the Fed dropped the use of the word ‘transitory’ to describe inflation towards the end of last year, the market remains almost completely unconcerned.
This is evidenced by the fact five-year break-even inflation rates ended 2021 at just 2.87%, while 10-year break-even inflation rates were below 2.60%.
This pricing leaves the market with the largest gap between current CPI rates (6.8%) and 10-year break-even inflation rates on record, as the chart below highlights.
Inflation dynamics and gold price
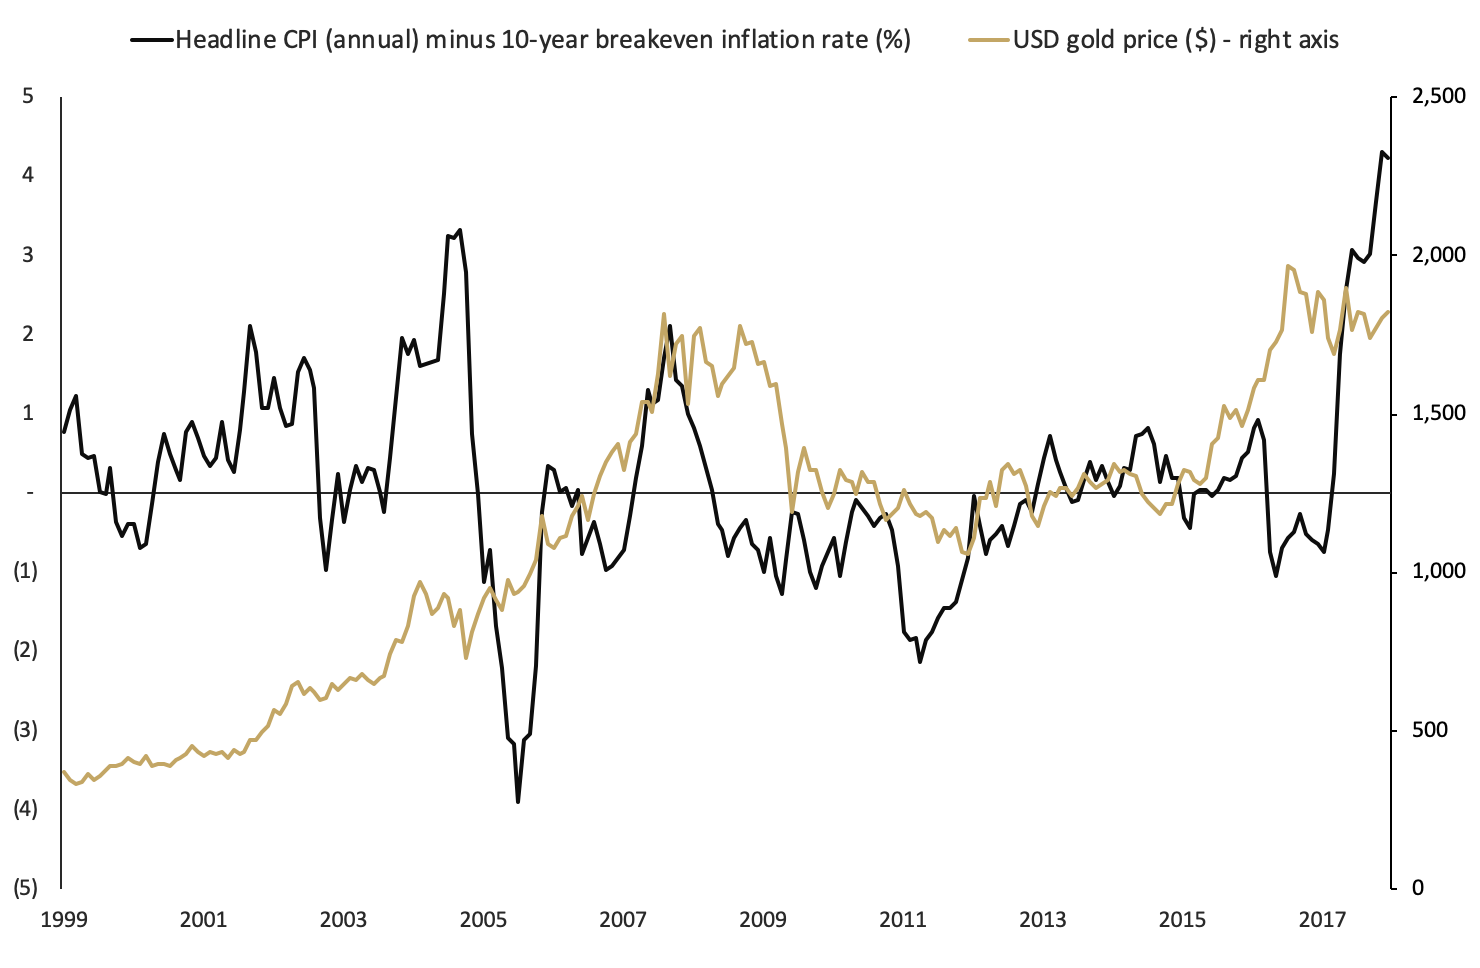
Source: The Perth Mint, World Gold Council, St Louis Federal Reserve
Moving forward, there’s plenty of room for the pace of consumer price inflation to fall a long way from current levels and still end up overshooting current market expectations.
Finally, it’s worth noting that gold has now worked through a roughly 15-month time period that at its worst saw prices correct by almost 20% from peak to trough.
Corrective cycles like this are part and parcel of every market, and indeed are often a healthy development as they allow the market to rid itself of excess froth and speculation.
That is largely what has happened in the precious metal market since Q3 2020, with managed money speculators cutting their net positioning by approximately 40% during this time. Global gold ETF holdings also fell by 8%.
Sentiment towards precious metals has also switched in this period from near unanimous bullishness in Q3 2020, to a far more subdued outlook today.
This was illustrated through a range of articles discussing gold, which was described as “unloved and uninteresting”, while a number of financial institutions have released bearish gold forecasts for 2022.
They may turn out to be correct, but it is of such things market bottoms are made.
(1) https://www.kitco.com/news/2021-12-30/J-P-Morgan-sees-gold-price-unable-to-withstand-the-Fed-falling-to-pre-pandemic-levels-in-2022.html
DISCLAIMER
Past performance does not guarantee future results. The information in this article and the links provided are for general information only and should not be taken as constituting professional advice from The Perth Mint. The Perth Mint is not a financial adviser. You should consider seeking independent financial advice to check how the information in this article relates to your unique circumstances. All data, including prices, quotes, valuations and statistics included have been obtained from sources The Perth Mint deems to be reliable, but we do not guarantee their accuracy or completeness. The Perth Mint is not liable for any loss caused, whether due to negligence or otherwise, arising from the use of, or reliance on, the information provided directly or indirectly, by use of this article.