Inflation fails to boost gold as precious metals fall
Precious metal prices suffered one of their largest monthly falls on record, with gold (-4.0%), silver (-10.5%), and platinum (-3.8%) falling sharply in US dollar terms. Rising real yields, a strong US dollar, expectations of a taper from the US Federal Reserve, and fallout from the Evergrande crisis in China, all contributed to the move, with gold now down close to 15% since the peak in August last year.
Summary of market moves
- Gold prices fell sharply during September, with the precious metal at one point falling toward USD 1,700 per troy ounce and ending the month down 4% in US dollar terms.
- Silver was hit even harder, falling by more than 10%, with the price dropping toward USD 21 per troy ounce.
- A declining Australian dollar, which ended September down almost 2% versus the US dollar mitigated losses for Australian investors, and saw gold finish the month just above AUD 2,400 per troy ounce.
- The pullback in gold has now seen the precious metal fall 15% since the highs in August 2020, with some now going so far as to question whether the precious metal has lost its status as a trusted inflation hedge.
Full report - September 2021
Precious metals were particularly volatile during September with gold (-4.0%), silver (-10.5%), and platinum (-3.8%) all falling sharply in US dollar terms, despite a rally to close out the month.
The declines in gold and silver, which saw the metals finish September just below USD 1,750 and just over USD 21.50 per troy ounce respectively, were among the sharpest monthly falls seen in the last three years, a period in which the two precious metals have increased by close to 50%.
Volatility was not confined to the precious metals space, with equities, commodities and fixed income markets also seeing large moves, driven by continued uncertainty regarding COVID-19, the challenges facing Evergrande and the broader Chinese property market, and expectations of tapering from the US Federal Reserve.
Focusing in on the precious metal space, several factors contributed to the weak price action, including:
- Higher real and nominal rates: 10-year treasury yields climbed above 1.50% in nominal terms, while in real terms they also increased from -1.03% to -0.85% in September.
- Continued appetite for risk assets: Despite the pullback seen in equities during the month, investors still have a strong appetite for risk assets, with the S&P 500 for example up by more than 15% this year.
- US dollar strength: The US dollar continued to march higher in September, with the Dollar Index (DXY) up almost 2% to trade above 94, the highest level seen in this calendar year.
- Fund positioning: Speculative investors cut back their long exposure in the gold futures market, with gross longs down by 12.5% from just over 136,000 contracts at the end of August, to just below 119,000 contracts by late September. Short positions, meanwhile, increased by 60% from 54,878 to 88,062 contracts over the month.
Given this backdrop, it’s no surprise that sentiment towards precious metals has also soured, with a range of bearish headlines dominating the news in the last month.
These include “How gold let me down, and other investing mistakes this year”, an article quoting high profile special purpose acquisition company (SPAC) investor Chamath Palihapitiya, who proclaimed Bitcoin has effectively replaced gold, and countless articles suggesting precious metals will see more short-term downside.
While there is nothing wrong with the articles per se, and in the short-term there are still bearish forces at work, the very fact gold is getting such bad press right now could be seen as an indicator that prices are close to bottoming.
Nowhere is this more evident than in the recent commentary surrounding gold and its status as a trusted inflation hedge, which many are beginning to doubt, given the correction in the gold price has occurred alongside a period of much higher consumer price inflation (CPI) readings in the United States.
We explore in detail below.
Gold and inflation: what you need to know
- Gold has fallen despite the rise in inflation during 2021.
- Gold has performed strongly across longer periods of higher inflation.
- Gold doesn’t need high rates of inflation to perform well.
- Gold is likely to benefit going forward if the inflation spike lasts longer than expected.
Ask most investors about gold and irrespective of whether or not they have exposure to the precious metal, most will acknowledge that it’s a store of value over the long-term, and that it’s a good inflation hedge.
The belief that gold helps to protect against inflation is understandable, given the precious metal has maintained its purchasing power across the centuries, something truly appreciated by those whose fiat currencies lost most if not all of their value.
In more modern times, gold has also served to protect wealth through periods of higher inflation, most notably throughout the 1970s, with the following table highlighting average annual returns for gold in high (>3% p.a.) and low (<3% p.a.) inflation environments across the past 50 years.
Average annual US dollar spot price of gold (%)
Inflation environment
Nominal return
Real return
High inflation (>3% p.a)
15.1
8.3
Low inflation (<3% p.a)
5.6
3.6
Despite this track record, a close to 15% correction in the USD price of gold since August last year, which has occurred despite consumer price inflation (CPI) rates rising to more than 5% p.a. at present, has many questioning whether the precious metal has lost its status as a trusted inflation hedge.
Why hasn’t gold moved higher with inflation in 2021?
Apart from the fact that gold rallied by approximately 70% between Q3 2018 and Q3 2020, there are several factors that have held the precious metal back in 2021.
These include a firmer US dollar, with the dollar index (DXY) up around 4% this year. Meanwhile, equities have enjoyed one of their strongest runs on record, with the S&P 500 almost doubling since the March 2020 low, supported by inflows into global equity funds in the first half of 2021 that were on track to exceed the total value of inflows seen in the prior 20 years combined.
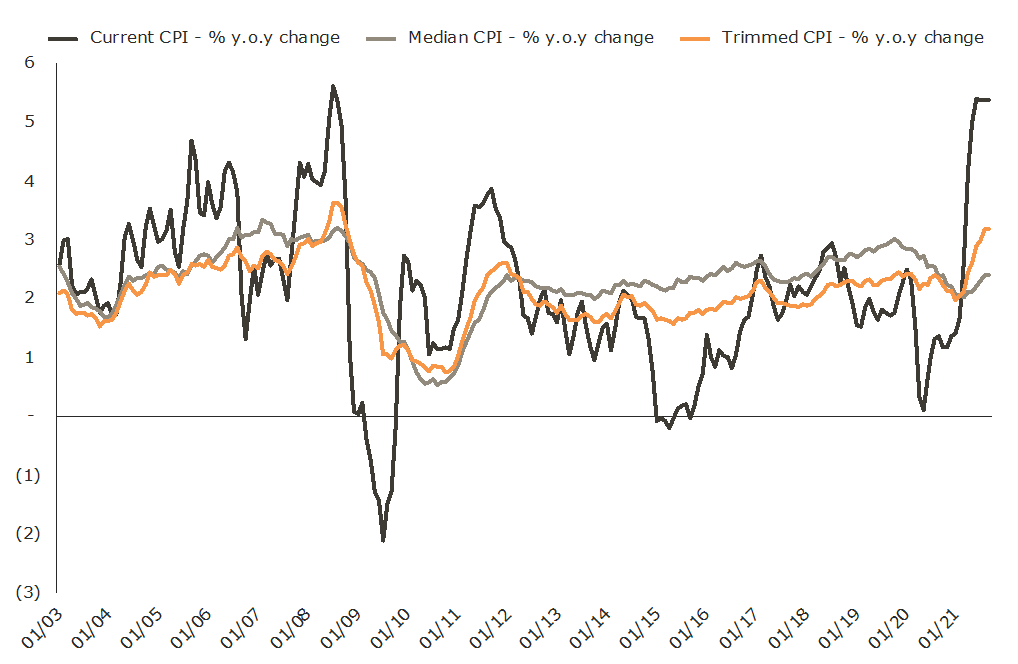
There is also the fact that the overwhelming belief in the market today is that the recent spike in inflation is likely to prove transitory, with headline CPI increases being driven higher by a small subsection of the inflation basket.
Whether this proves right or wrong remains to be seen, though the chart below, which plots annual changes in headline CPI, as well as median and trimmed mean CPI, helps explain why the market is willing to give to the transitory narrative the benefit of the doubt for now.
US inflation indicators
Gold made a huge move in 2020
Perhaps a bigger part of the reason gold has disappointed investors in 2021 is that it made such a big move in the first nine months of last year.
This can be seen in the table below, which shows a handful of key variables at the end of 2019 and each quarter of 2020.
Market indicators during 2020
Date
10 year real yield (%)
CPI - y.o.y change (%)
10 year breakeven inflation rate (%)
Fed balance sheet
Gold price
31/12/19
0.15
2.29
1.72
4,115,957.50
1517.01
31/3/20
-0.17
1.54
0.99
4,618,977.00
1577.68
30/6/20
-0.68
0.65
1.27
7,127,786.25
1768.1
30/9/20
-0.94
1.37
1.66
7,048,374.20
1886.9
31/12/20
-1.06
1.36
1.92
7,319,010.80
1891.1
Source: Federal Reserve, World Gold Council, Cleveland Federal Reserve, US Treasury, St Louis Federal Reserve
Looking at the table we can see that:
- The Federal Reserve balance sheet increased by more than USD 3 trillion across the first six months of 2020.
- Real yields on 10-year US treasuries fell by more than 1% in the first three quarters of 2020.
- 10-year breakeven inflation rates bottomed out in Q1 2020, well ahead of short-term CPI numbers.
Given this backdrop, it is no surprise the gold price was up by more than 30% at one point in 2020, even though the official year on year change in headline inflation was below 2%.
So, while its true gold hasn’t been a very good inflation hedge in 2021, that’s coming off the back of a year that the precious metal recorded one of its strongest gains on record.
Ultimately, perhaps what the data is telling us is that if you have to wait for the official statistician to tell you inflation has arrived, then you’ll pay a much higher price to buy inflation protecting assets.
Gold doesn’t need high inflation to prosper
It’s important to note that while high inflation is typically conducive to higher gold prices, the precious metal doesn’t need high rates of inflation to prosper.
This is evidenced in the chart below, which shows the USD gold price, annual changes in CPI, and average inflation rates across the past five decades.
Gold and US inflation data since 1970
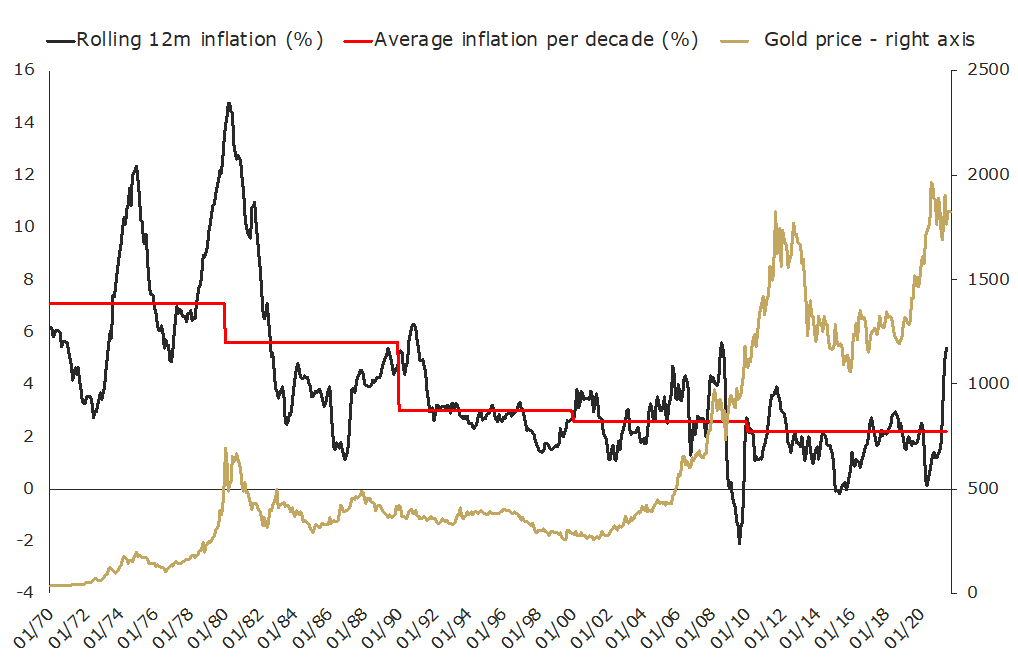
Source: World Gold Council, St Louis Federal Reserve
The chart makes it clear that gold rose very strongly in the first decade of the new millennium, even though inflation rates were declining relative to rates of price growth seen in the 1980s and 1990s.
The table below provides more detail on this, highlighting annualised inflation rates and gold price returns over each of the last five decades.
Gold and US inflation data by decade
Decade
Inflation (total increase)- %
Gold (total increase)- %
Inflation (increase p.a.) - %
Gold (increase p.a.) - %
1970s
103.98
1,344.29
7.39
30.61
1980s
64.24
(21.33)
5.09
(2.37)
1990s
33.65
(28.62)
2.94
(3.32)
2000s
28.76
281.11
2.56
14.32
2010s
18.91
38.45
1.75
3.31
Source: World Gold Council, St Louis Federal Reserve
Be it stock market volatility, geopolitical uncertainty, recessions or global pandemics, there are clearly a range of other factors that can and do influence gold at various points in the investment cycle.
Gold and the inflation backdrop today
An argument can be made that the market’s view of inflation today looks somewhat similar to just over 10 years ago, in the period leading into the Global Financial Crisis (GFC).
This can be seen in the following chart, which shows the gold price, as well as the percentage gap between current inflation rates and the 10-year breakeven inflation rate expected by the market.
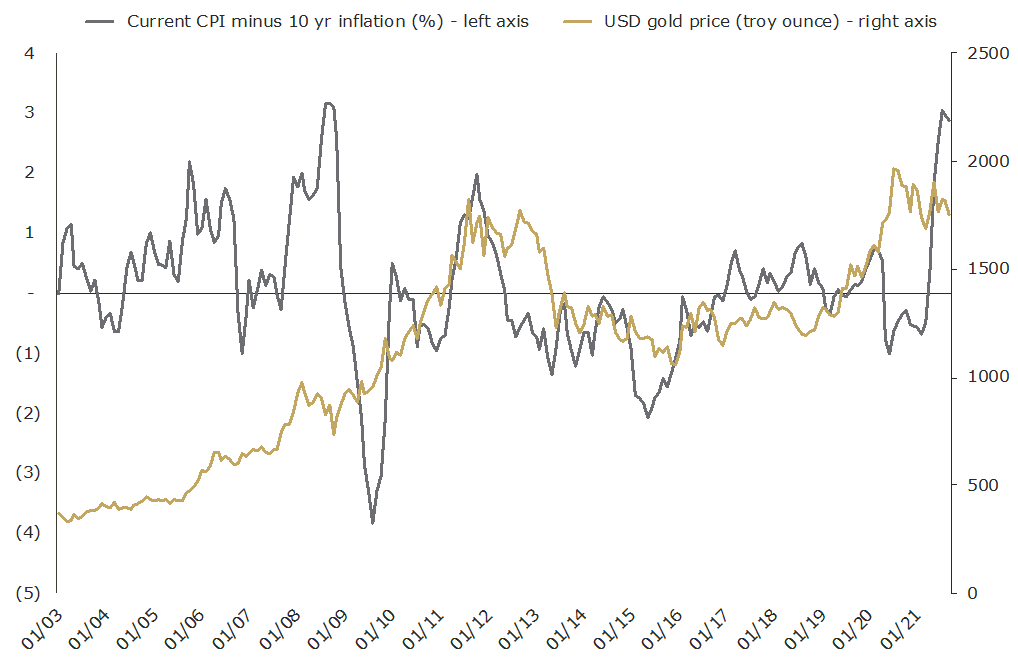
Source: Cleveland Federal Reserve, St Louis Federal Reserve, World Gold Council
The chart highlights that at present, there is an almost 3% gap between current annual CPI (+5.25%) and the 10-year breakeven inflation rate (2.35%). This has not been seen since Q3 2008.
Interestingly, gold prices fell by approximately 20% back then, from just below USD 1,000 per troy ounce, to just below USD 750 per troy ounce. As we all know, the precious metal then went on to rally for the next three years, with the market ultimately topping out more than 150% higher at close to USD 1,900 per troy ounce in 2011.
This time around we’ve seen a similar pullback, with gold dropping by approximately 18% between August 2020 and the low from this cycle seen in April 2021, when gold temporarily traded back below USD 1,700 per troy ounce.
And while no one can be certain if history will repeat or even just rhyme, there is a range of factors suggesting gold could be well supported going forward, including:
- Central bank and fiscal largesse: The post GFC environment was characterised by central banks reluctantly adopting QE, ZIRP and other forms of unconventional monetary policy, and promising to walk it back at the first opportunity. Despite talk of the Fed tapering in late 2021, the post COVID-19 environment sees central banks largely reticent to abandon expanded stimulatory measures, with a much greater focus on full employment, an embrace of average inflation targeting, and the adoption of MMP (modern monetary practice) through the de facto monetisation of federal deficits.
- Trimmed mean inflation rising: While headline inflation rates may ease, there is clearly an increase in underlying pricing pressure building, with the trimmed mean inflation measure now comfortably above 3% per annum.
- Supply side shocks: Whether it’s a shortage of fuel in the UK and across Europe, industry shutdowns in China, or continued bottlenecks in global supply chains, issues on the supply side look like they’ll add some upward price pressure well into 2022.
It’s also critically important to note that the market expects the recent spike in inflation to be transitory and has largely priced this in already. As such, even if headline CPI rates decline in the months ahead, they’re unlikely to hurt precious metals. If the recent inflation spike proves not to be as transitory as currently expected, then there is a good chance we’ll see a surprise to the upside when it comes to the gold price going forward.
Combine this with a current environment that sees sentiment toward gold near all-time lows, and we have the potential makings of a market bottom playing out in front of us right now.