Volatile month for precious metals as gold turns 50

Gold prices displayed heightened volatility during August, with a large sell off seen early in the month before the precious metal staged a recovery to close back above USD 1,800 per troy ounce. Silver was also impacted, at one point falling by almost 10% intra-month, though it too finished on a stronger footing. Despite the volatility, a range of factors look set to support precious metal markets going forward.
Summary of market moves:
- Precious metal prices were particularly volatile during August, with gold ending the month falling by almost 1%, while silver fell by almost 6%.
- Equity markets continued to rally, with the S&P 500 closing above 4,500 points at the end of August, up almost 3% for the month. The ASX200 was up 2% during August.
- Cryptocurrency prices continued their recent recovery, with Bitcoin ending the month trading just below USD 47,000, up almost 10%.
- The Australian dollar continued to weaken, falling almost 1% versus the US dollar, driven by falling iron ore prices and continued uncertainty caused by lockdowns along the Eastern seaboard.
- The spread of the COVID-19 Delta variant continued to plague the global economy, with central banks, including the US Federal Reserve, which just completed its annual Jackson Hole Symposium, likely to provide significant levels of monetary policy stimulus for the foreseeable future.
- August 2021 marked 50 years since the United States ended convertibility of the US dollar into gold, with the precious metal subsequently playing a valuable role in investment portfolios over the past five decades.
Full report - August 2021
Volatility in precious metal markets picked up during August, with gold and silver prices at one point falling 8% and 9% respectively in US dollar terms. The two precious metals then rallied as August came to a close, with gold recovering almost all its losses to trade back above USD 1,800 per troy ounce, down just 1% for the month as a whole.
Silver finished the month trading back above USD 24 per troy ounce, down 6%, with daily movements in prices throughout August seen in the chart below.
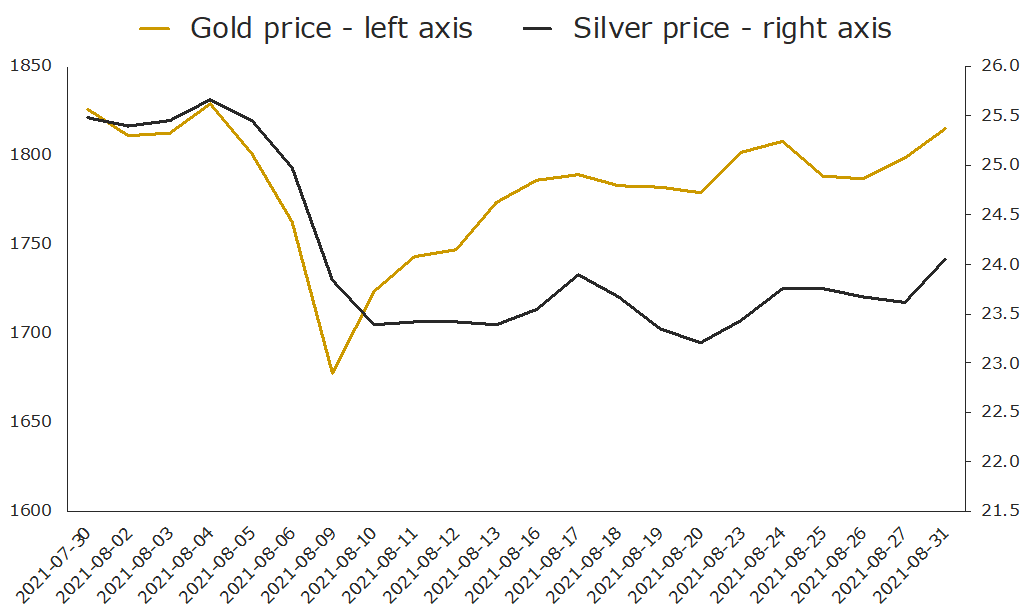
The sell-off that occurred in early August, which can be seen in the above chart, was driven by a rapid liquidation that took place in the gold futures market on the morning of Monday 9 August.
In the space of one hour, more than 35,000 gold contracts (with a notional market value of over USD 6 billion) were traded, with more than half of the turnover happening in one 15-minute time slot. In that window prices fell 4% from USD 1,755 to USD 1,677 per troy ounce.
While much speculation has taken place as to what drove that level of turnover in such a short time frame, the data makes it clear that the market hit an air pocket of sorts, with the drop driven predominantly by a short-term lack of liquidity. The fact that gold recovered a good part of the losses within the day reinforces this view.
Indeed, the sharp sell-off seen on 9 August may end up marking the completion of the corrective cycle in gold, with the metal rallying more than 8% since. Multiple factors have driven the rally, including:
- The threat posed by the COVID-19 Delta strain, with the daily case rate in the United States back above 150,000 and continuing to surge, despite the fact almost 65% of the adult population has been fully vaccinated.
- Heightened geopolitical tension in the wake of the withdrawal of American and other coalition troops from Afghanistan.
- A continued dovish tone from the US Federal Reserve, with Chairman Jerome Powell using the annual Jackson Hole Symposium to reassure markets the Fed is in no rush to begin tapering asset purchases, let alone normalise monetary policy in any meaningful sense.
The speech from Powell noted that while the US job market was recovering, there was still a long way to go. He also reiterated the Fed’s view that the recent spike in inflation will prove transitory (more on this below, where we discuss whether or not gold remains an inflation hedge).
It was enough to boost stock markets, cause a fall in the US dollar, and ultimately, help boost gold back over USD 1,800 and silver back above USD 24 per troy ounce as August came to a close.
Is gold still an inflation hedge?
Five decades of market data tells us conclusively that gold tends to perform well during periods of higher consumer price inflation (CPI), with average annual increases in excess of 15% per annum in the years CPI rates are 3% or higher.
However, given gold has been in a corrective cycle since peaking above USD 2,000 per troy ounce in August last year, and given this time period has coincided with an uptick in CPI, questions about whether gold is still an inflation hedge continue to be asked in financial blogs, podcasts etc.
We are encouraged by the very fact this question is getting airtime, as it’s the kind of thing you only see when sentiment toward gold has soured and when prices have eased, which is often a good time to be buying.
As we highlighted last month, there are multiple factors that have contributed to gold falling in the last year despite the uptick in inflation - from soaring stock prices to the market’s belief that the current surge in inflation will prove transitory.
This month we want to delve a little deeper, looking at the difference between current annual rates of CPI, and the market’s expectation for average inflation over the next 10 years (called the breakeven rate). As per the table below, there is now a 3% gap between current CPI, which was 5.4% in July, and the 10-year breakeven rate.
Annual change in CPI and 10 year breakeven inflation rate (%)
Annual change in CPI (%)
10 year breakeven inflation rate (%)
Gap - current CPI vs 10 year expectations (%)
5.4
2.4
3
Source: St Louis Federal Reserve, 10 year breakeven inflation rate taken as at August 11
The chart below, which dates back to 2003, shows the difference between these two readings on a monthly basis, as well as the gold price itself over the same time period.
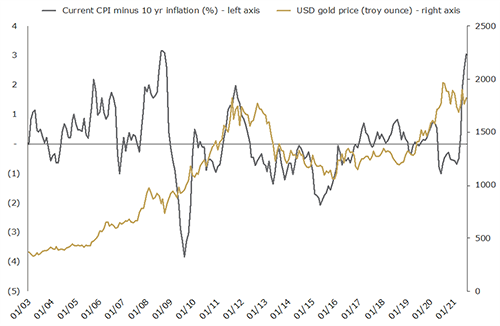
The standout observation from the chart is that the inflation differential between CPI levels and the 10-year breakeven rate, which is 3% right now, is as pronounced as it was back in Q3 2008, around the time the Global Financial Crisis hit.
History shows that equities fared horribly in the period that followed, falling by 40% over the next six months. Gold, on the other hand, went from strength to strength, rallying by more than 100% in the three years that followed.
The chart, and the fact the market doesn’t think that the current high rates of CPI will last, is encouraging for another reason. Markets don’t react to formal data releases like CPI, GDP, or employment figures - they react based on what a data release is relative to what the market expected the data release to be.
As such, even if inflation rates do ease in the months ahead, it may not negatively impact gold at all, as the market already expects this to happen.
Billionaires are bullish gold
For those unfamiliar with the name, John Paulson was one of the few investors that not only foresaw the problems in the US housing market that would culminate in the sub-prime crisis and the GFC, but also put his money on the line, making billions of dollars in the process.
He has also long been a fan of gold, with the below extract from a recent interview with Bloomberg (subscription required ), highlighting his current view on the precious metal.
Bloomberg: “After you made your famous trade, you bought a lot of gold, or gold futures, and you were called by some a gold bug. Gold’s now about $1,700 an ounce. Do you think that gold is a good investment at this price?”
Paulson: “Yeah, we do. We believe that gold does very well in times of inflation. The last time gold went parabolic was in the 1970s, when we had two years of double-digit inflation.
The reason why gold goes parabolic is that basically there’s a very limited amount of investable gold. It’s on the order of several trillion dollars, while the total amount of financial assets is closer to $200 trillion. So as inflation picks up, people try and get out of fixed income. They try and get out of cash. And the logical place to go is gold. But because the amount of money trying to move out of cash and fixed income dwarfs the amount of investable gold, the supply and demand imbalance causes gold to rise.”
Bloomberg: “So, you’re a big believer in gold as a good investment now?”
Paulson: “Yes. We thought in 2009 with the Fed doing quantitative easing, which is essentially printing money, it would lead to inflation. But what happened was while the Fed printed money, at the same time they raised the capital and reserve requirements in banks.
So, the money sort of recycled. The Fed bought Treasuries, created money, which wound up in the banks and then was redeposited at the Fed. And the money never really entered the money supply. So, it wasn’t inflationary. However, this time it has entered the money supply. The money supply was up about 25% last year and the best indicator of inflation is money supply. So, I think we have inflation coming well in excess of what the current expectations are.”
Paulson isn’t the only high-profile investor singing gold’s praises, with Mark Mobius, who spent the better part of 30 years managing emerging market portfolios, and once served as the executive chairman of Templeton Emerging Markets Group, recently stating investors should hold up to 10% of their portfolios in gold.
Like Paulson, Mobius sees the value in holding gold given the potential for significant currency devaluation in the years to come.
Gold turns 50
August 2021 marks the 50-year anniversary of the closing of the “gold window”, with then US President Richard Nixon ending the convertibility of the US dollar into gold. Since then, the price of gold has risen by approximately 8% per annum, outperforming a range of traditional asset classes over this period.
Alongside the strong long-term returns, gold has also offered investors:
- An effective equity market hedge and portfolio diversifier, with gold typically being the best performing asset whenever equity markets suffer their most significant corrections.
- Protection from monetary uncertainty, with gold delivering positive real returns in periods of high inflation, and in periods of low inflation.
- Accessibility, with gold being an asset class that every investor can include in their portfolio, irrespective of their budget.
While none of these attributes guarantee what will happen to the gold price from one day to the next, in time they can all be expected to support gold demand, and therefore prices, especially given the continued uncertainty plaguing the global economy, the monetary environment we are in, and how expensive financial markets as a whole are.
For this reason, we remain optimistic on the outlook for gold over the medium to long-term and why we think that alongside silver it will continue to play an important role in diversified portfolios.
DISCLAIMER
Past performance does not guarantee future results. The information in this article and the links provided are for general information only and should not be taken as constituting professional advice from The Perth Mint. The Perth Mint is not a financial adviser. You should consider seeking independent financial advice to check how the information in this article relates to your unique circumstances. All data, including prices, quotes, valuations and statistics included have been obtained from sources The Perth Mint deems to be reliable, but we do not guarantee their accuracy or completeness. The Perth Mint is not liable for any loss caused, whether due to negligence or otherwise, arising from the use of, or reliance on, the information provided directly or indirectly, by use of this article.