Gold remains solid as bitcoin melts

Among a group lamenting the worrying state of the world – war in Eastern Europe, carnage on stock markets, inflation driving cost of living pressures to unbearable levels – one investor was heard to utter in despair: “I can’t look at my crypto wallet right now. It’s losing so much!”
The price of bitcoin crashed below USD 30,000 in May and has struggled to make headway since. The last time the price fell this low was July 2021. Later that year it surged towards USD 69,000. Now the market has been spooked into a radical reversal, all highly unsatisfactory for those who have bought into the ‘digital gold’ narrative around bitcoin.
Often used to promote cryptocurrencies, the line argues that bitcoin can provide a store of value similar to gold. Being negatively correlated to financial markets, bitcoin and its ilk will help protect the overall value of an investment portfolio in troubled times, or so its backers claim.
And yet, bitcoin’s slump is coinciding with the sell off on Wall Street and other markets worldwide.
“The selling points for crypto assets used to be that they weren’t correlated to other assets classes and therefore would provide diversification from conventional holdings of shares and bonds and also provide a hedge against inflation. It turns out none of those previous investor convictions has proven true,” business columnist Stephen Bartholomeusz wrote in the Sydney Morning Herald.
Others point out that bitcoin has been behaving more like a speculative tech investment. Research published by The Perth Mint in February 2021 indicated that bitcoin beat gold hands down from the perspective of generating speculative returns in rapid fashion. But it was 12 times more volatile than the precious metal.
While Elon Musk, the world’s richest man, may be relatively unconcerned by bitcoin’s recent performance, some everyday investors inspired by his enthusiasm for the crypto are clearly feeling the pinch!
The Perth Mint believes it is still too early to claim bitcoin can replace gold but understands that the media ‘buzz’ created by high profile investors will keep it at the front of mind for many. Without so many column inches, the benefits of gold are often more opaque, particularly in the minds of new investors. Given the excessive volatility of cryptos like bitcoin, it’s a great time for anyone seeking refuge for their money to familiarise themselves with gold’s track record.
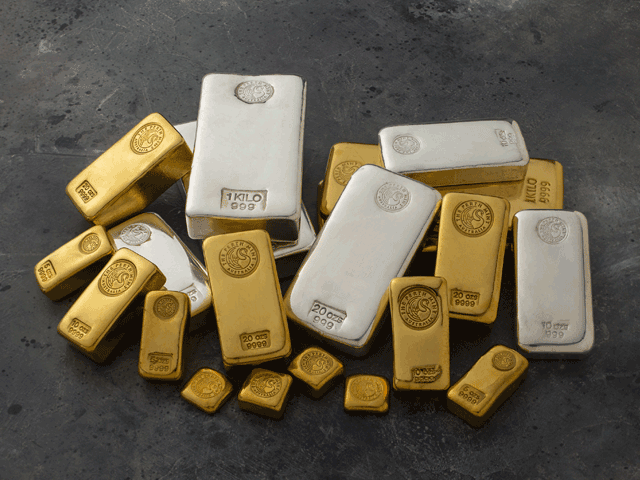
Gold is one of the best performing assets this millennium
Gold has been one of the best performing asset classes of the current millennium. The table below highlights end of year gold prices in both US dollars and Australian dollars per troy ounce, and the calendar year returns seen across the last 20 years.
End of year gold prices in US and Australian dollars and % returns since 2001
Year
AUD gold price return %
USD gold price return %
AUD gold price
USD gold price
2001
9.4
0.7
540.1
276.5
2002
14.2
25.6
616.6
347.2
2003
-10.4
19.9
552.5
416.3
2004
0.6
4.6
555.7
435.6
2005
25.9
17.8
699.3
513
2006
14.7
23.2
801.8
632
2007
18.4
31.9
949.6
833.8
2008
31.4
4.3
1247.5
869.8
2009
-3.1
25.0
1209.2
1087.5
2010
13.4
29.2
1371.2
1405.5
2011
8.9
8.9
1493.4
1531
2012
6.9
8.3
1596.5
1657.5
2013
-15.7
-27.3
1346.3
1204.5
2014
9.5
0.1
1473.7
1206
2015
-1.1
-12.1
1456.9
1060
2016
8.6
8.1
1582.5
1145.9
2017
4.3
12.7
1650.6
1291
2018
10.1
-0.9
1816.8
1279
2019
18.6
18.4
2154.9
1514.8
2020
13.9
24.8
2455.3
1891.1
2021
1.2
-4.5
2484.3
1805.8
Source: The Perth Mint, World Gold Council, LBMA, RBA
Despite the occasional negative calendar year return, long-term investors in gold have been well rewarded, with the price of gold rising by 553% in US dollar and 360% in Australian dollar terms over this period.
Gold’s performance relative to other asset classes
Not only has gold performed well in absolute terms over the last 20 years, but it’s also done so in relative terms, with the precious metal either matching, or in many cases exceeding, the returns generated by other asset classes.
The following table highlights the returns delivered by gold on an annualised rate of return over multiple time periods to the end of 2021, compared to the returns delivered by traditional asset classes, including Australian shares, cash and housing, over the same timeframe.
Asset class returns (%) over multiple time periods to end 2021
Asset class
1 year %
3 years %
5 years %
10 years %
15 years %
Gold in AUD
1.3
11.1
9.4
5.1
7.9
ASX 200
13.0
9.6
5.6
6.3
1.8
Cash
0.03
0.6
1.1
1.9
3.1
Australian bonds
-3.3
3.0
3.5
4.2
5.4
Australian REITS
21.6
8.5
4.7
8.5
-2.2
Balanced pension diversified fund before fees
11.1
9.1
7.5
8.6
6.3
Source: Chant West, The Perth Mint, Australian Bureau of Statistics, World Gold Council
It makes clear that over the last 15 years, no other mainstream asset has outperformed gold, a testament to the beneficial role that it could have played in a diversified portfolio.
Gold is an effective hedge against equity market falls
One of the chief arguments for gold is its ability to act as a hedge against volatility in the stock market. This is understandable, as history highlights gold’s ability to rise when the stock market falls, balancing out overall portfolio returns.
A look back at the performance of gold and the local equity market in Q1 2020 demonstrates this point. The ASX 200 suffered an almost 30% decline in March 2020 as fears over COVID-19 and the measures taken to limit its spread caused a huge decline in economic activity.
Over the same period, the price of gold in Australian dollars rallied more than 20%, helping to protect the portfolios of investors with an allocation to the precious metal.
The performance of gold during this time was not an anomaly. Instead, it was a continuation of a trend that has been in place for 50 years, with gold typically serving as an excellent hedge against falling equity markets.
Gold is an important diversifier even when equities are rising
Gold’s positive role is not limited to time periods where shares fall sharply.
This table, which uses market data from 1971 to 2020 inclusive, reveals the average return for equities and for gold in the months, quarters and years when the equity market has risen, as well as when the equity market has fallen.
Average gold and equity returns when equities fall and when equities rise % – 1971 to 2020
Equity market
Time period
Equities %
Gold %
Equities rising
Monthly
3.9
0.8
Quarterly
7.9
2.2
Yearly
22.2
10.5
Equities falling
Monthly
(3.6)
1.0
Quarterly
(6.7)
3.8
Yearly
(14.7)
16.7
Source: The Perth Mint
It shows that gold is positively correlated to rising equity markets, and negatively correlated to falling equity markets. More precisely, the table tells us that:
- The average gain for equities in the months when equities rose was +3.9%. In the same months, the average return on gold was +0.8%.
- The average loss on equities in the quarters when equities fell was -6.7%. In these same quarters, the average return on gold was +3.8%.
Given all these credentials, how would investors well-versed in digitally enabled alternative financial services go about securing gold via an online platform?
ASX:PMGOLD wins recommended rating from Lonsec
Among offerings from The Perth Mint, our ASX-listed PMGOLD enables investors to trade in gold via a stock broking account as they would shares on the ASX.
Tracking the price of gold in Australian dollars, PMGOLD holds more than 260,000 troy oz of the precious metal on behalf of investors. With a management fee of 0.15%, making it the lowest cost gold ETF on the ASX, it’s unique in that client metal is fully underpinned by government-backed physical gold that exists within the Mint.
Recently reviewed by Lonsec, one of Australia’s leading research houses, PMGOLD has been awarded its Recommended Rating.
To find out more, please visit perthmint.com/invest
DISCLAIMER
Past performance does not guarantee future results. The information in this article and the links provided are for general information only and should not be taken as constituting professional advice from The Perth Mint. The Perth Mint is not a financial adviser. You should consider seeking independent financial advice to check how the information in this article relates to your unique circumstances. All data, including prices, quotes, valuations and statistics included have been obtained from sources The Perth Mint deems to be reliable, but we do not guarantee their accuracy or completeness. The Perth Mint is not liable for any loss caused, whether due to negligence or otherwise, arising from the use of, or reliance on, the information provided directly or indirectly, by use of this article.