Roller coaster ride for gold as Biden backs Powell

- Gold prices went on a volatile ride during November, rising toward USD 1,900 per troy ounce (oz) in the early stages of the month, as official inflation rates in the United States topped 6% year on year.
- The precious metal was unable to hold onto these gains, with gold plunging more than USD 100oz in a couple of days after it was confirmed Jerome Powell would serve another term as the Chair of the US Federal Reserve.
- Despite the intra-month swings, gold ended the month up 2%, and has now climbed more than 100 US dollars (+7%) since the lows seen in late March 2021.
- Silver (-4.8%), platinum (-6.4%) and palladium (-10.4%) were unable to rally alongside gold. Driven by oil, which fell 13% in thin trading over the Thanksgiving long-weekend, the broader commodities complex fell during the month, ending November down more than 7%.
- The Australian dollar fell by 5% during November, ending the month trading just above USD 0.71. This weakness bolstered the AUD gold price, pushing it back above 2,500oz.
- Bitcoin continued to display its legendary volatility, with the price down almost 15% from the intra-month high, finishing November below 60,000 US dollars per coin.
- Equity markets fell modestly in November, with the S&P 500 down 1%. YTD the US equity market is still up almost 25%, while the ASX 200 was -2.20% for the month (+8% YTD).
- Real yields on US treasury bonds declined across the maturity spectrum during November, with 10 years falling from -0.92% to -1.07%.
- The emergence of the Omicron variant has raised uncertainty about the path forward for the global economy, with the CEO of Moderna raising concerns regarding reduced protection levels for existing vaccines.
- While the situation remains fluid, COVID-19 remains a risk factor for financial markets and global economic growth as we head into next year.
Futures market drove gold in November
The November price action in gold was a clear illustration of the important role futures play in driving short-term moves in the precious metal.
The table below shows managed money positioning (long, short and net) in the futures market and how it changed across the month, as well as the gold price, noting this article was published before data for November 30 was available.
Date
Long
Short
Net
USD gold
26/10/21
141,280
54,918
86,362
1,785.6 oz
02/11/21
136,944
51,705
85,239
1,790.50 oz
16/11/21
185,468
43,083
142,385
1,859.20 oz
23/11/21
152,273
46,934
105,339
1,789.20oz
Source: YCharts, CFTC
The movements in positioning across the month in part explain gold’s price move, with the 35% surge in long positioning (67% net) between November 2 and November 16 coinciding with the sharp rally seen in that time period.
It’s not just the last month either, with movements in net positioning and the USD gold price from August 2020 through to November seen in the chart below.
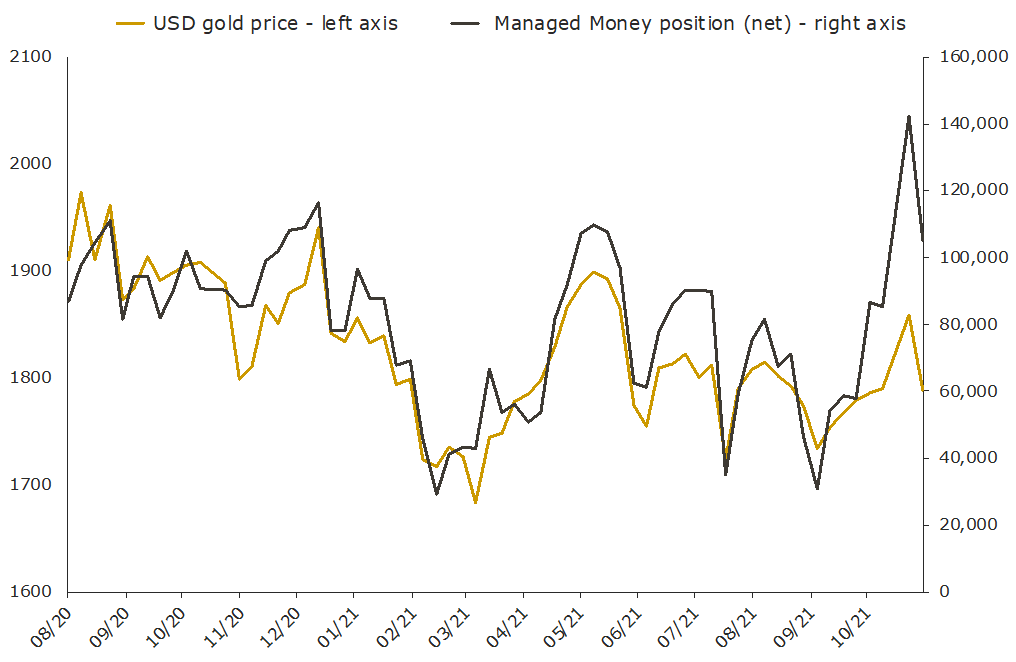
Source: YCharts, CFTC
The correlation between changes in positioning, and movements in the gold price is evident, explaining why this an important indicator to track.
Federal Reserve news saw gold sell off
While gold surged more than USD 100oz in the first half of November, and at one point looked like it might push beyond USD 1,900oz, the market did a complete one-eighty after US President Joe Biden decided to reappoint Jerome Powell for another term as the Chair of the US Federal Reserve (the Fed).
Between November 19 and November 23, the precious metal gave up nearly all of the gains it had recorded earlier in the month, dropping back below USD 1,800oz. The Powell reappointment was seen by the market as an indicator that the Fed will push forward with its QE tapering programme.
While the sell-off in gold was brutal, the market was ripe for a correction, especially given the extended futures market positioning on display by mid-month.
The spike in real yields (the US 30-year bond went from -0.52% to -0.36% between 19 and 23 November), and in the US Dollar Index (+2.2% for the month), were also factors driving gold lower in the second half of November.
Singapore adds to gold reserves
Since the onset of the global financial crisis just over a decade ago, central banks have turned net buyers of gold, adding more than 5,000 tonnes of gold to national reserves. Almost all of this buying has been concentrated in emerging markets, with nations like China, Russia, India and Turkey leading this gold buying spree.
Singapore has also recently joined the list of nation states buying gold, with news released in November that they’d increased holdings for the first time in decades. In total, they added just over 25 tonnes to their reserves, an increase of about 20%.
Across the entirety of 2021, central bank demand will likely see 400 tonnes of gold added to national reserves, with World Gold Council data highlighting it will largely be driven by strong inflows in the first half of the year, with the pace of acquisition slowing since June.
ETF data also suggests investors are again modestly adding to positions, though they are minor, with global holdings estimated to have risen by about 10 tonnes in November.
Outlook
With one month left to go, gold is so far on track to end the year down modestly, having started 2021 trading around USD 1,900oz.
While that may seem like a disappointing result given the spike in inflation rates seen this year, it needs to be remembered that it is coming off the back of a two-year time-period between Q3 2018 and Q3 2020 that saw the price rise by approximately 70% in USD terms.
The pullback in gold has also occurred in an environment of rising stock prices S&P 500 +22% YTD, a strong uplift in economic activity (The Atlanta Fed GDPNow model estimates real GDP growth will be +8.4% year on year for Q4 2021), and a rising USD, with the Dollar Index up +7% YTD in the first 11 months of the year.
Moving forward, the outlook for gold demand remains positive, with continued support likely to come from central banks and households in Asia, India and the Middle East. These segments of the market have collectively accounted for close to 90% of all newly mined gold in the last decade.
That gold would benefit from a ‘flight to safety’ is particularly likely given the paucity of real yield available in developed market sovereign debt, record low credit spreads, and inflationary pressures that are unlikely to meaningfully abate as we head into next year.
DISCLAIMER
Past performance does not guarantee future results. The information in this article and the links provided are for general information only and should not be taken as constituting professional advice from The Perth Mint. The Perth Mint is not a financial adviser. You should consider seeking independent financial advice to check how the information in this article relates to your unique circumstances. All data, including prices, quotes, valuations and statistics included have been obtained from sources The Perth Mint deems to be reliable, but we do not guarantee their accuracy or completeness. The Perth Mint is not liable for any loss caused, whether due to negligence or otherwise, arising from the use of, or reliance on, the information provided directly or indirectly, by use of this article.